
HP XP P9000 Performance Advisor Software v5.5 User Guide (T1789-96337, Februrary 2013)
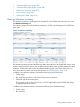
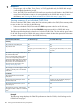
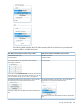

The individual performance data for CHA-1EU includes the following:
• Summary:
Fibre protocol is used◦
◦ Eight ports are associated with CHA-1EU
◦ Port Activity Avg shows average I/Os as 10409.17, which is an average of the overall
average I/Os on all the eight ports. It also displays the average MB/s as 81.33, which
is the an average of the overall average MB/s on all the eight ports.
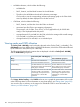
• Port Details:
CL1A, CL5A, CL3A, and CL7A are the ports for CHA-1EU◦
◦ Maximum and minimum I/Os
◦ Maximum, minimum, and average throughput of data in MB/s
For example, the Max I/Os and Min I/Os for CL1A are 17290.00 and 5998.00
Related Topics
• “Viewing performance summary” (page 175)
• “Viewing ACP/DKA data” (page 187)
• “Viewing MP blade utilization for P9000 disk arrays” (page 191)
• “Viewing Smart and ThP pools data for P9000 disk arrays” (page 195)
• “Utilization Summary” (page 181)
• “10 busiest LDEVs/Ports” (page 205)
• “10 busiest LDEVs/RAID groups” (page 206)
• “Port summary” (page 209)
• “Viewing LDEV data” (page 212)
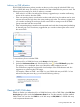
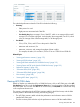
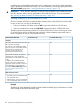
Viewing ACP/DKA data
Based on whether you selected an XP or a P9000 disk array, click an ACP/DKA pair in the ACP
Pair Backend group box under the Performance View tab to view the summary of all the installed
ACP/DKA pairs. You can also click ACP for an XP disk array or CHA/DKA for a P9000 disk array
in the component selection tree.
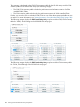
The summary is displayed in the ACP/DKA summary table for the XP disk arrays and the DKA
summary table for the P9000 disk arrays (see following images).
• The ACP/DKA summary table includes the performance and utilization metrics of all the
installed ACP/DKA pairs
• The DKA summary table includes only the performance metrics of all the installed DKAs
Viewing ACP/DKA data 187