
HP XP P9000 Performance Advisor Software v5.5 User Guide (T1789-96337, Februrary 2013)

Related Topics
• “Viewing performance summary” (page 175)
• “Viewing ACP/DKA data” (page 187)
• “Viewing MP blade utilization for P9000 disk arrays” (page 191)
• “Viewing Smart and ThP pools data for P9000 disk arrays” (page 195)
• “Utilization Summary” (page 181)
• “10 busiest LDEVs/Ports” (page 205)
• “10 busiest LDEVs/RAID groups” (page 206)
• “Port summary” (page 209)
• “Viewing LDEV data” (page 212)
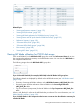
Viewing MP blade utilization for P9000 disk arrays
Click an MP blade ID in the MP Blades Util% group box under the Performance View tab to view
the corresponding utilization summary on the MP Blades screen. You can also click MP Blades in
the component selection tree.
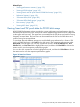
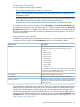
The following image shows the MP Blades Util% group box.
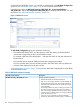
If you click an MP blade ID (for example, MPB-1MA) in the MP Blades Util% group box:
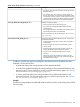
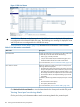
The following details are displayed by default on the MP Blades screen (see “MP Blades screen”
(page 192)):
• Summary of average MP blade utilization in the MP Blade Summary <MP_blade_ID> table
• Processing types and their utilization of the MP blade in the Processing Distribution
<MP_blade_ID> table
• Top 20 consumers (components) for the MP blade in the Top Components <MP_blade_ID>
table
Where, <MP_blade_ID> refers to the MP blade that you selected. For more information, see “MP
blade utilization summary” (page 192).
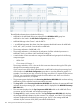
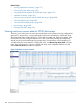
If you click MP Blades in the component selection tree or want to view the utilization summary for
another MP blade:
Viewing MP blade utilization for P9000 disk arrays 191