
HP XP P9000 Performance Advisor Software v5.5 User Guide (T1789-96337, Februrary 2013)
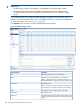

204). You can also click a particular record to highlight the record and then click Plot Chart to
choose the metrics and view the respective performance graphs.
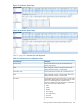
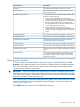
Table 16 (page 203) describes the data displayed:
Table 16 CA Volume performance data and Journal Information
DescriptionScreen elements
LDEV configured as the PVOL or SVOL LDEV on the array
for which user is viewing the data.
CA-VOL
The total I/Os on the LDEV per second.IOPS
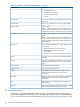
The total MB/s of data written to the LDEV based on the
selected volume type (S-VOL or P-VOL) per second.
MBPS
Displays the total backend tracks associated with selected
volume type (S-VOL or P-VOL).
Backend Tracks
The average read response time of LDEV based on the
selected the volume type (S-VOL or P-VOL).
Avg Read RT
The average write response time of LDEV based on the
selected volume type (S-VOL or P-VOL).
Avg Write RT
The average host port assigned per I/O based on the
selected volume type (S-VOL or P-VOL).
Avg Host Port IO
The average host port assigned per MB based on the
selected volume type (S-VOL or P-VOL).
Avg Host Port MB
The total percentage of CLPR data usage that is configured
for the selected volume type (S-VOL or P-VOL).
CLPR Usage %
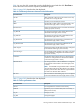
The percentage of data pending to be written on an LDEV
from the CLPR that is configured for the selected Volume
type (S-VOL or P-VOL).
Write Pending %
The utilization of the side file shown as a percentage for
a CLPR that is configured for the selected volume based
on the volume type (S-VOL or P-VOL).
Side File %
The average utilization of the MP blade that is configured
for the selected volume based on the volume type (S-VOL
or P-VOL).
NOTE: The MP blade average utilization data is collected
during the DKC performance data collection. The collection
frequency set for the DKC data collection might be different
from that set for the LDEV data collection.
MP Blade Util %
The total utilization of each RAID group which is configured
for the volume based on the volume type (S-VOL or P-VOL).
RG Util %
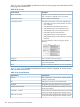
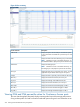
Table 17 (page 203) describes the data displayed:
Table 17 CA Port performance data
DescriptionScreen elements
Port assigned for the continuous access activity.CA-Port
Type of the port, such as the Fibre (Cont Acc Initiator), or
Fibre (Ext-Lun Initiator).
Attribute
Average I/O rate.Avg IO
Average throughput.Avg MB
Viewing continuous access data for P9000 disk arrays 203