
HP XP P9000 Performance Advisor Software v5.5 User Guide (T1789-96337, Februrary 2013)
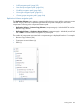
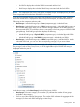
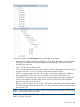

In the above image, under Snapshot Pool for the XP disk array 10090:
• Snapshot Pool is the main category. The number (1) indicates the number of snapshot pools
configured on the XP disk array 10090.
• Pool ID:25 is one of the individual snapshot pools.
• LDEVs is a component type. The number (4) indicates the number of Ldevs associated with the
Snapshot Pool ID:25.
◦ 9:C9 is one of the individual LDEV.
◦ RG(s) is a component type. The number (1) indicates the Raid Group associated with the
Snapshot Pool ID:7.
• VVols is a component type. The volumes listed under VVols are grouped based on host groups.
The number (1) besides VVols indicates the total number of host groups using the Snapshot
Pool ID:25. Click VVols to view the list of associated host groups.
◦ SHADOW is one of the individual host group.
◦ S-Vol is the component type. The number (1) indicates the number of LDEVs configured
as SVols and associated with the host group SHADOW.
◦ P-Vol is the component type. The number (1) indicates the number of LDEVs configured
as P-Vols and associated with the S-Vol A:1E.
The LDEVs and VVols can also be traced under the Back-end category. For more information, see
“Back-end navigation path” (page 244).
The applicable metrics are displayed in the Available Metrics Choose Metric Category list. Select
the metrics at the component type or the individual component levels, or both and view the related
performance graphs in the Chart Work Area. For a description of these metrics, see “Metric
Category, metrics, and descriptions” (page 387).
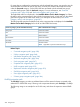
The following table provides the default set of metric categories that are displayed in the Available
Metrics Choose Metric Category list for the XP and the P9000 disk arrays.
Most used default metric categorySnapshot Pool category for XP and P9000 disk arrays
Frontend IO MetricsSnapshot pool ID
Utilization MetricsRGs
Frontend IO MetricsLDEVs
Frontend IO MetricsVVols
Frontend IO MetricsHost Group
Frontend IO MetricsPVol
Frontend IO MetricsSVol
Related Topics
• “Front-end navigation path” (page 238)
• “Cache navigation path” (page 240)
• “MP Blades navigation path” (page 242)
• “Back-end navigation path” (page 244)
• “Replication Volumes navigation path” (page 253)
• “Pools navigation path” (page 247)
252 Using charts