
HP XP P9000 Performance Advisor Software v5.5 User Guide (T1789-96337, Februrary 2013)
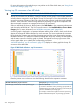
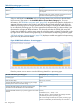
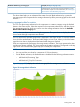
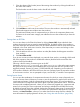
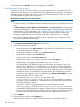

Table 22 Processing types (continued)
DescriptionProcessing types
Indicates all the backend activities involved in processing target
I/O requests.
Backend
Indicates all the array system activities involved to service all
the above-mentioned processing type requests.
System
Select an MP blade from MP Blades in the component selection tree and choose the MP Blade
Util/Processing Type metric in the Available Metrics Choose Metric Category list. For more
information, see “MP Blades navigation path” (page 242). A stacked area graph is displayed in a
separate Utilization Metrics chart window and displays the MP blade utilization split up for the
different processing types. Each area represents the percentage of average MP blade utilization
by an individual processing type. The X-axis represents the duration that you select and the Y-axis
represents the average MP blade utilization. The chart title includes the P9000 disk array DKC
number, the MP blade ID, and the metric name for which the graph is plotted. The legends on the
top right corner of the stacked area graph help you to identify the corresponding processing types.
“MP blade utilization - Processing types” (page 274) displays a stacked area graph for the processing
types served by the MPB-1MA blade.
Figure 28 MP blade utilization - Processing types
Place the pointer over an area to view the following details for a processing type:
Example (see Figure 28 (page 274))MP blade utilization by processing types
SystemProcessing type
08/12/10, 10:36:36Date and time stamp
3.12%Average MP blade utilization by a processing type (average
from the previous to the current time stamp)
Total: 19.02%Average MP blade utilization by all the processing types
associated with the MP blade for the overall duration
(16.4%)Average MP blade utilization by a processing type for the overall
duration
Calculated as (3.12 / 19.02) * 100
The value 16.4% in 19.02% indicates the average utilization
contributed by the System processing type.
The 16.4% average utilization by the System processing type
is further contributed by the associated top 20 consumers. It
274 Using charts