
HP XP P9000 Performance Advisor Software v5.5 User Guide (T1789-96337, Februrary 2013)

B Sample reports
Report types
HP XP P9000 Performance Advisor supports report generation for the following categories:
• “Array performance reports” (page 359).
• “LDEV IO reports” (page 367).
• “RAID Group Utilization Report” (page 370).
• “Cache utilization reports” (page 370).
• “ACP utilization reports” (page 373).
• “CHIP utilization reports” (page 374).
• “XP Thin Provisioning (THP) pool occupancy” (page 376).
• “Snapshot pool occupancy” (page 377).
• “Continuous Access Journal group utilization” (page 378).
• “Creating an LDEV Activity report” (page 303).
• “Export Database report” (page 379).
• “All report” (page 380).
• “MP blade utilization report” (page 380)
The reports can be generated in the HTML, RTF, PDF, and the CSV formats.
NOTE: You must install the Acrobat Reader to view reports in the PDF format.
The sample reports are given below.
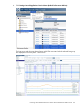
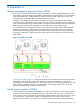
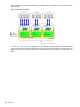
Array performance report
The Array Performance report provides the overall performance of an XP or a P9000 disk array
by measuring the total I/Os and the read and write I/Os on that array. The Array Performance
report comprises of the following reports:
• Total I/O Rate
• Total I/O Rate by hour of day
• Total I/O Rate Detail
• Read-Write Ratio
• Read-Write Ratio by hour of day
• Read-Write Detail
• Max/Min Frontend Port IOPS
• Max/Min Frontend Port MB/s
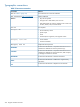
In addition, it includes a section called Findings at the beginning of the report.
IMPORTANT:
• The Findings section for an XP disk array provides a brief summary on the status of the CHIPs,
cache, ACP, and the LDEVs.
• The Findings section for a P9000 disk array provides a brief summary on the status of the
cache, LDEVs, and the MP blades.
• The utilization summary of the CHIP/CHA and the ACP/DKA MPs are not displayed in the
Array Performance report - Findings section for the P9000 disk arrays.
Following is a sample Findings section for a P9500 Disk Array:
Report types 359