
HP XP P9000 Performance Advisor Software v5.5 User Guide (T1789-96337, Februrary 2013)
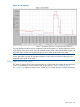
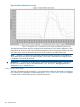
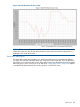
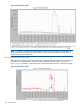
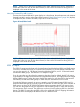
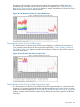
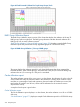

Figure 40 Read/Write Ratio
For example, the data point of X on the graph indicates X% read activity and (100-X)% of write
activity.
NOTE: If there are no data points available for the dates selected, blank chart is displayed. If
all the data values are zero for the dates selected, a chart with a horizontal line along X axis is
displayed in the center of the chart.
Read/Write Ratio by hour of day report
The Read/Write Ratio by hour of day report displays in a chart format, the ratio of read activity
to write activity, over a 24 hour period. It is for both sequential and random read, or write activity.
“Read/Write Ratio by hour of day” (page 365) displays a sample Read/Write Ratio by hour of
day report for a P9500 Disk Array.
364 Sample reports