
HP XP P9000 Performance Advisor Software v6.0 User Guide

NOTE:
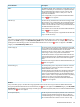
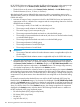
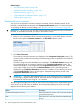
• Click Add New Licenses to add licenses for the XP and the P9000 disk arrays on the License
screen. For more information, see “Installing licenses” (page 30).
• Click Edit Threshold to specify the threshold limits and threshold duration.
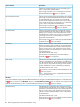
• If you have modified the threshold limits for an XP or a P9000 disk array, manually refresh
the Dashboard screen to view the updated dashboard status.
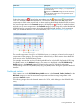
TIP: To maximize a section, click the window icon on the top right corner of each section on the
Dashboard screen.
Related Topics
• “Dashboard threshold metrics” (page 100)
• “XP/P9000 array health” (page 104)
• “Dashboard statistics” (page 105)
• “Dashboard busiest consumers” (page 110)
• “Dashboard charts” (page 111)
• “High watermark in dashboard charts” (page 112)
• “Plotting charts” (page 233)
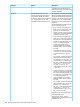
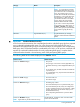
XP/P9000 array health
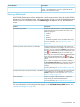
The following table describes the different status icons that depict the overall health of the XP and
the P9000 disk arrays in the Frontend, Cache, Backend, and the MP Blade (applicable for only
the P9000 disk arrays) categories.
DescriptionStatus icon
Critical.
Indicates that the usage of at least one component has
crossed the set threshold limit during the specified threshold
duration.
Warning.
Indicates that the usage of at least one component is at
95% of the set threshold limit or higher during the specified
threshold duration.
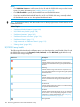
Normal.
Indicates that the usage of all components is below 95%
of the set threshold limit during the specified threshold
duration.
No Perf Data.
Indicates that the performance data is not collected during
the specified threshold duration.
Disabled.
Indicates that the threshold settings are not yet configured
for the metrics in the corresponding categories. For more
information on setting threshold limits, see “Configuring
dashboard threshold settings” (page 97).
Not applicable.
104 Monitoring performance of XP and P9000 disk arrays