
HP XP P9000 Performance Advisor Software v6.0 User Guide
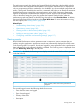

Table 7 Viewing alarm History records (continued)
DescriptionScreen elements
NOTE: The Resource is displayed as PVOL: LDEVID
(serial number) and SVOL: LDEVID (serial
number) for the Pair Status alarms.
Displays the current performance value that is recorded for
a component. Click the <Value> link to view graphical
Value
representation of the performance of a component. For more
information, see “Viewing graph of metric value's
performance” (page 134).
Displays the threshold value that you set for the component.
HP XP P9000 Performance Advisor triggers an alarm if the
Dispatch Threshold
performance value of a component rises or drops below the
set threshold value.
Displays the time when a record was first displayed for a
component on the Alarm History screen.
Time Posted
The Time Posted displays a new time stamp again when HP
XP P9000 Performance Advisor creates a new record for
the same component after dispatching the appropriate alarm
notification.
Displays the time stamp when HP XP P9000 Performance
Advisor updates the current performance value of a
Time Updated
component under Value. The Time Updated does not display
any time stamp if the alarm configured for a component is
deleted or alarm is disabled on the Alarm Configurations
screen.
Displays the time stamp when the alarm notification is
dispatched to the intended recipient.
Time Dispatched
Displays the status on email and SNMP notifications, and
script execution. The five possible statuses are listed as
follows:
Status
• Status 0: Timed Out : in case alarm can not be triggred
in the given time(this time is specified in the
Email_TimeOut field of the serverparameters.properties
file)
• Status 1: InCorrect SNMP Setting : in case SNMP address
is invalid
• Status2: SNMP Protocol Error: In case there is problem
in sending mail to SNMP server
• Status 3: Failed to dispatch : Runtime problem like
network connectivity etc
• Status 4: Successful
NOTE: In case email, SMTP or Script is not configured,
then the status is displayed as NA.
Related Topics
• “Filtering records in Alarms History table” (page 132)
• “Viewing graph of metric value's performance” (page 134)
• “Adding or removing metric values” (page 116)
• “Configuring notification and monitoring settings” (page 117)
Managing alarms history 131