
HP XP P9000 Performance Advisor Software v6.0 User Guide

Cache Utilization report
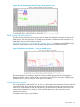
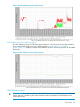
The Cache Utilization report displays in a chart format, the cache utilization in an XP or a P9000
disk array.
“Cache Utilization” (page 372) displays a sample Cache Utilization report for a P9500 Disk Array.
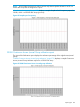
Figure 50 Cache Utilization
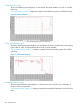
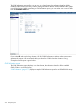
Cache Write Pending report
The Cache Write Pending report displays in a chart format, the amount of data in the cache waiting
to be written to a disk. It helps determine the amount of cache available.
“Cache Write Pending” (page 372) displays a sample Cache Write Pending report for a P9500
Disk Array.
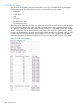
Figure 51 Cache Write Pending
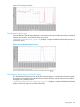
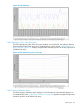
Percentage Read Hits report
The Percentage Read Hits report displays in a chart format, cache read hits as a percentage of
the total cache read operations.
“Percentage read hits” (page 373) displays a sample Percentage Read Hits report for a P9500 Disk
Array.
372 Sample reports