
HP XP P9000 Performance Advisor Software v6.0 User Guide
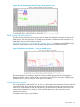
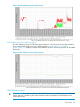

LDEV Activity report
You can view the maximum and least busiest LDEVs in an XP or a P9000 disk array through the
LDEV Activity report. The LDEV data can be for one of the following metric types:
• FontEndIO
• BackEndIO
• MB
• Utilization
• Read Response Time
• Write Response Time
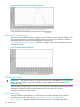
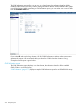
The maximum and least busiest LDEVs are collated based on the maximum and minimum threshold
levels you specify, and also the metric type that you select. For the metric type and duration that
you specify, the average of the total performance of each LDEV is considered. Further, the average
value is verified with the set threshold levels to see if that particular LDEV's performance is above
or below the threshold limit. Based on their average values, the LDEVs are grouped in the top 100
busiest or the least 100 busiest LDEVs, and displayed in the CSV file. It implies that only those
LDEVs that are above the maximum and below the minimum set threshold limits are considered.
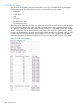
Figure 64 LDEV Activity report
380 Sample reports