
HP XP P9000Watch and HP XP P9000Sketch Reference Guide for HP XP P9000 Performance Advisor v5.5 (T1789-96341, February 2013)
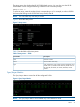
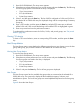

1. Start HP XP P9000Watch. The Array menu appears.
2. Select the array whose performance you want to monitor and press the Enter key. The following
list of host group options connected to the array is displayed:
• 1 Sync/Async Metrics
• 2 CA Journal Metrics
• 3 Host Group Metrics
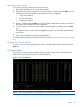
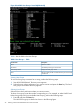
3. Select 2, and then press the Enter key. The list of LDEVs configured as P-VOLs and S-VOLs in
the selected XP or P9000 disk array are displayed along with the corresponding Consistency
Group Ids.
4. Enter a CTG number, and then press the Enter key. Multiple CTG entries are not allowed.
All the P-VOL and S-VOL records that belong to the selected CTG are highlighted in green.
5. Enter c to proceed and view the performance metrics.
To understand the performance metrics for P-VOLs, S-VOLs, and journal groups, see “CA Journal
Metrics” (page 45).
Clearing CTG selection
To clear a CTG record selection, enter its corresponding CTG number, and then press the Enter
key.
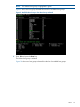
Host Group Metrics
The Host Group metrics screen displays the different options that you can choose to view the host
group, RAID group, port, and LDEV metrics for the selected XP or P9000 disk array.
Viewing Host Group Metrics
To view the Host Group metrics:
1. Start HP XP P9000Watch. The Array menu appears.
2. Select the array whose performance you want to monitor and press the Enter key. The following
list of host groups connected to the array is displayed.
• 1 Sync/Async Metrics
• 2 CA Journal Metrics
• 3 Host Group Metrics
3. Select 3 and press the Enter key. The list of host groups are displayed.
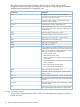
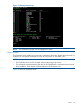
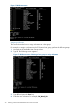
Host Groups
The Host Groups screen lists the available host groups that are connected to the selected XP or
P9000 disk array. This screen also displays all the available Navigation, Selection, and
Miscellaneous options. The list of host groups are sorted alphabetically based on the host group
name.
Figure 8 shows the Host Groups.
Menus 25