
HP XP P9000Watch and HP XP P9000Sketch Reference Guide for HP XP P9000 Performance Advisor v5.5 (T1789-96341, February 2013)


7 Viewing performance metrics in HP XP P9000Sketch
This section describes loading the .csv files, setting the Java heap size value, and viewing
performance metrics in HP XP P9000Sketch.
Loading the Comma separated file
The performance metrics obtained on monitoring the selected XP or the P9000 disk array’s host
groups, ports, LDEVs, RAID, CPU, and DKC groups including the array level metrics for a specified
duration are stored in seven .csv files, one file for each component.
The .csv files generated using HP XP P9000Watch in the Interactive mode can be opened in HP
XP P9000Sketch to obtain a graphical representation of the data.
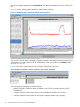
You must load the .csv file in HP XP P9000Sketch, which transforms the metrics into various data
points on the graph. You can also select multiple metrics and view the values plotted on the graph.
Using these graphical representations, you can analyze the performance trend, identify bottlenecks
or problems, and take the necessary corrective actions.
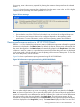
On the File menu, select Load to open the .csv file in HP XP P9000Sketch. If HP XP P9000Sketch
is not installed on the same system as HP XP P9000Watch, you can still copy the .csv file generated
by HP XP P9000Watch, and load it on the system (host) where HP XP P9000Sketch is installed.
If the format of the selected .csv file does not match the input file format that HP XP P9000Sketch
requires, an error message displays stating that the selected file’s format is not supported. The
following is a sample format of a .csv file:
$$$ START COLUMN HEADERS $$$
Sample Time
Metric1
Metric2
.
.
.
$$$ END COLUMN HEADERS $$$
Time in format ’MM-dd-yy hh:mm:ss’, value for Metric1, value for metric2,.....
Time in format ’MM-dd-yy hh:mm:ss’, value for metric1, value for metric2,…
Click File menu, and select Close to close the .csv file in HP XP P9000Sketch.
Click File menu, and select Exit to stop and close HP XP P9000Sketch.
NOTE: The above sample is in the TLVIz format and seven .csv files are generated, one file for
each component.
Setting the Java heap size value
At a time, the number of metrics that can be loaded in HP XP P9000Sketch depends on the minimum
and maximum Java heap size values specified for HP XP P9000Sketch. The default minimum and
maximum Java heap size values are 70 MB and 128 MB respectively.
You can increase the maximum Java heap size value by modifying a property value in run.bat.
By default, when you open run.bat in the Command Prompt window, the following data is displayed:
java -Xms70m —Xmx128m XPSketch
where: -Xms70m refers to the minimum Java heap size value (the minimum system memory that is
required for HP XP P9000Sketch to load a .csv file in HP XP P9000Sketch), and –Xmx128m refers
to the maximum Java heap size value. The maximum Java heap size value refers to the maximum
system memory that can be set based on the memory available in your system and also the metrics
collected in the .csv file.
The Java heap size value is directly proportional to the metrics collected in a .csv file, and also
the combination of metrics that you want to view in a graphical format. More the metrics collected,
more is the memory required (Java heap size value) to load the .csv file. More the metrics selected
58 Viewing performance metrics in HP XP P9000Sketch