HP XP P9000Watch and HP XP P9000Sketch Reference Guide HP Part Number: T1789-96355 Published: March 2014 Edition: 1
© Copyright 2014 Hewlett-Packard Development Company, L.P. Confidential computer software. Valid license from HP required for possession, use or copying. Consistent with FAR 12.211 and 12.212, Commercial Computer Software, Computer Software Documentation, and Technical Data for Commercial Items are licensed to the U.S. Government under vendor's standard commercial license. The information contained herein is subject to change without notice.
Contents 1 Introduction to HP XP P9000Watch...............................................................6 Overview................................................................................................................................6 HP XP P9000Watch environment................................................................................................7 Functional representation...........................................................................................................
P-VOL S-VOL LDEV performance metrics............................................................................42 P-VOL S-VOL RAID Group performance metrics..................................................................42 P-VOL S-VOL CLPR performance metrics............................................................................43 P-VOL S-VOL Port performance metrics..............................................................................43 CA Journal Metrics....................................
Average read response time................................................................................................70 Average write response time................................................................................................70 9 Support and other resources......................................................................71 Contacting HP........................................................................................................................71 Related information...
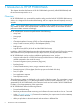
1 Introduction to HP XP P9000Watch This chapter describes the features of HP XP P9000Watch (previously called P9000Watch) and the environment required to run it. Overview HP XP P9000Watch is a command-line interface utility provided with HP XP P9000 Performance Advisor. It is designed for focused troubleshooting and can capture data as frequently as every 5 seconds. NOTE: The 5 seconds data capture frequency applies to XP or P9000 disk array configured with any number of LDEVs.
• Customizable menu size • Nicknames can be provided to the host groups for easy identification • Command-line tool with easy-to-use selection menu • Configuration changes that are reflected with every fresh run • Small footprint and easy to execute, does not require any special installation For more information on installing the HP XP P9000 Performance Advisor, see the HP XP P9000 Performance Advisor Installation Guide.
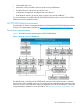
2 Installing HP XP P9000Watch This section describes installing and removing HP XP P9000Watch. It also describes the various components of HP XP P9000Watch. Prerequisites The following are the prerequisites to install HP XP P9000Watch: • The HP XP P9000 Performance Advisor host agent v6.0 must be installed on your host system. • The host must have a command device connected to the XP or P9000 disk arrays array to collect information from that disk array.
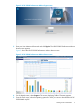
Figure 2 HP XP P9000 Performance Advisor logon screen 3. Enter your User Name and Password and click Sign In. The HP XP P9000 Performance Advisor Home screen appears. Figure 3 shows the HP XP P9000 Performance Advisor Home screen. Figure 3 HP XP P9000 Performance Advisor home screen 4. 5. On the Header menu, select Support. The screen displaying Table of Contents appears. From the Tools menu, select the operating system for which you want to download the HP XP P9000Watch zip file.
6. 7. Extract the contents of the zip file to a location on your system. The XPWatch.exe and wagent.exe files are extracted. Double-click XPWatch.exe to run HP XP P9000Watch. You can also run HP XP P9000Watch using the command prompt. For example,c:\XPWatchTool\XPWatch.exe where, XPWatchTool is the folder containing the XPWatch.exe file. In your command-prompt window, ensure that you point to the directory where HP XP P9000Watch is installed.
mode. There are three different commands that can be used. The entire command should be entered at the command prompt, without which HP XP P9000Watch will exit. For more information on the commands to execute HP XP P9000Watch in CLI mode, see “Executing commands in CLI mode” (page 18). Removing HP XP P9000Watch To remove HP XP P9000Watch, delete the folder containing the XPWatch.exe file.
Components The software components of HP XP P9000Watch are: 12 • XPWatch.exe—is an executable file used to launch the HP XP P9000Watch tool. • wagent.exe—is an executable file required to operate HP XP P9000Watch. • XPWatch.log—stores information about the execution cycle of HP XP P9000Watch when the debug mode is enabled. • settings.ini—this file contains the default or customized menu settings. It is generated after the first use of HP XP P9000Watch.
• .csv—is the output file that saves performance data. In the Interactive mode, the .csv files are generated depending on the configured settings. However, in the CLI mode, these files are generated every hour. For every hour different .csv files are created, one file for each component. For better understanding, consider the following two scenarios: Example scenario 1: In the Interactive mode, if you set the Data Split Time to two hours and the Data Collection Time Limit to six hours, three sets of .
– -PVOL_SVOL_CLPRPERF-.csv – -PVOL_SVOL_LDEVPERF-.csv – -PVOL_SVOL_RGPERF-.csv – -JNL_CLPRPERF-.csv – -JNL_LDEVPERF-.
Host Group metrics ◦ – -LDEVPERF-.csv – -PORTPERF-.csv – -RGPERF-.csv – -CPUPERF-.csv – -DKCPERF-.
3 Working with HP XP P9000Watch menus and commands This section describes how to use the different modes, commands, menus, and interfaces of HP XP P9000Watch. Commands This section describes the menus and the options you choose in the Interactive mode, as well as the commands that you execute in the CLI mode. To see the Help options in the Interactive mode and CLI mode, the following command can be executed in the command prompt: For Windows platform, xpwatch.exe –h For a non-Windows platform, .
Figure 4 HP XP P9000Watch commands Table 1 lists the Navigation options available in the HP XP P9000Watch interface and their functions. Table 1 Navigation options and their functions Command Option Function b Back To view the previous menu. c Continue To view the next menu. n Next page To view the next set of items, such as host groups, ports, RAID groups, and LDEVs. p Previous page To view set of items, such as host groups, Ports, RAID groups, and LDEVs displayed on the previous page.
Table 3 lists the Miscellaneous options available in the HP XP P9000Watch interface and their functions. Table 3 Miscellaneous options Command Option Function s Settings To change the settings of HP XP P9000Watch. x Nickname Menu To view the Nickname menu. Executing commands in CLI mode NOTE: • If none of the below mentioned commands are provided, HP XP P9000Watch is executed in the Interactive mode. Syntax conventions Table 8 lists the symbols that are used to depict command syntax.
—hrs This parameter is used to specify the number of hours for which HP XP P9000Watch must be active. —min This parameter is used to specify the number of minutes for which HP XP P9000Watch must be active. NOTE: It is mandatory to specify either the —hrs or —min option. You can also specify both the options. .
./xpwatch –c –s –w [–f ] [–a ] –hrs —min —c To view the HP XP P9000Watch in CLI mode. —s To specify the XP or P9000 disk array serial number. —w To view the list of WWNs in the comma separated format. NOTE: There should be no space in between the comma separating the WWNs. For example, —w 500143800081fba0, 5001438000ac164c —f This is an optional parameter.
The Array menu also displays the HP XP P9000Watch version. You can also view the HP XP P9000Watch version using the following command in the command prompt: XPWatch.exe -v To select an array, enter the number (Num) corresponding to it. For example, to select a P9000 disk array that belongs to the P9500 disk array model, enter 3. NOTE: You can select only one array at a time. Table 5 lists the fields of the Array menu. Table 5 Array menu—fields Screen field Description Num Selection number.
Screen field Description Type RAID type for the RAID group. Ld[MB] Size of the LDEV in MB. State Current replication link status of the P-VOL or S-VOL on the selected XP or P9000 disk array.
To understand the performance metrics for P-VOLs and S-VOLs, see “Sync/Async Metrics” (page 41). Clearing P-VOL or S-VOL selection To clear a P-VOL or S-VOL record selection, enter its corresponding number, and then press the Enter key. CA Journal Metrics The CA Journal metrics screen lists all the configured P-VOLs and S-VOLs in the selected XP or P9000 disk array based on the CTGs to which they belong.
Screen field Description shown is corresponding to only the selected XP or P9000 disk array and can be one of the following: • SMPL: Unpaired volume • PAIR: Paired duplicate volume • COPY: In paired state but copying to secondary volume not complete • PSUS: In paired state but updating the secondary volume data is suspended • PSUE: PSUS state due to internal error • PFUS: PSUS state due to Side File Full MUN Mirror Unit number of the paired volume.
Viewing Host Group Metrics To view the Host Group metrics: 1. Start HP XP P9000Watch. The Array menu appears. 2. Select the array whose performance you want to monitor and press the Enter key. The following list of host groups connected to the array is displayed. 3. • 1 Sync/Async Metrics • 2 CA Journal Metrics • 3 Host Group Metrics Select 3 and press the Enter key. The list of host groups are displayed.
Table 6 Host Groups — fields Screen field Description Num Selection number. Nickname User-friendly names given to the hosts. Host Group Name Displays the host group name. Ports The port used by the XP or P9000 disk array to communicate with the host. Viewing Host Groups To view the host groups connected to an array, perform the following steps: 1. Start HP XP P9000Watch. The Array menu appears. 2. Select the array whose performance you want to monitor and press the Enter key.
Figure 8 Available Host Groups: One Host Group selected 2. Enter 118 and press the Enter key. The Kalam host group is selected. Figure 9 shows two host groups selected from the list of available host groups.
Clearing Host Groups To clear a selected host group, enter its corresponding number. For example, to clear the Kalam host group, enter118 and press the Enter key. The Kalam host group is cleared. Figure 10 shows the screen that appears after clearing the Kalam host group. Figure 10 Clearing a Host Group NOTE: The cleared host groups are not highlighted in green. Nickname menu The Nickname menu enables you to provide a nickname to the host to identify the host easily.
Figure 11 Nickname menu Assigning nicknames This section describes how to assign nicknames to a host group. For example, to assign a nickname to the FS-Pyramus host group, perform the following steps: 1. Navigate to the Available Host Groups screen. 2. Type x. The following screen appears. Figure 12 Nickname menu: Selecting a host group to assign nickname 3. 4. Type 97 and press the Enter key. Enter the new nickname. For example, PA_Watch_HA.
Figure 13 Nickname menu: Entering new nickname 5. Press the Enter key. The following screen, showing nickname as PA_Watch_HA, appears. Figure 14 Nickname menu: Displaying new nickname Renaming nicknames To rename a nickname, perform the following steps: 1. Select the host group whose nickname you want to rename and press the Enter key. 2. Enter the new nickname and press the Enter key.
Deleting nicknames To delete a nickname, select the host group whose nickname you want to remove and press the Enter key twice. For example, to remove the PA_Watch_HA nickname, perform the following steps: 1. On the Available Host Groups screen, type 97. The following screen appears. 2. Press the Enter key. (Do not enter any new nickname) The Host Nickname is removed and the following screen appears.
Port menu The Port menu lists all the ports that are connected to the selected host groups. This menu is used to select the port whose performance needs to be monitored or captured. Figure 15 shows the Port menu. Figure 15 Port menu Table 7 describes the fields that appear in the Port menu.
Viewing Port menu To view the ports connected to a host, perform the following steps: 1. Start HP XP P9000Watch. The Array menu appears. 2. Select the array whose performance you want to monitor and press the Enter key. 3. The Available Host Groups screen displaying the list of host groups connected to the array appears. 4. Select the required host and enter the c command. The Port menu showing all ports connected to the hosts appears.
Figure 17 RAID Group menu Table 8 describes the fields that appear in the RAID Group menu.
Figure 18 LDEV menu Table 9 describes the fields that appear in the LDEV menu. Table 9 LDEV menu — screen fields Screen field Description Num Selection number LDEV CU: LDEV number RG RAID group Emulation Emulation type Slpr SLPR number NOTE: Slpr does not exist in the P9000 disk arrays. So, the Slpr field displays N/A for the P9000 disk arrays in the output screen of the LDEV menu.
Figure 19 Settings menu Menu settings Menu settings enable you to modify the settings of the interface. For example, the Menu settings allow you to modify the appearance of the menus. Table 10 describes the Menu settings. Table 10 Menu settings Settings Functions Default Value Valid Range Menu Height Changes the number of items that appear in the menu. 20 lines 1-50 lines Debug Mode Disabled • If this mode is enabled, the program creates a file XPWatch.
Table 11 Performance data collection settings Settings Functions Default value Data Split Time Splits the data according to the time intervals (in hours) and stores 24 hours them in different .csv files. This is used when large amount of data is collected. For example: If you have selected the Data Split Time as 1 and the Data Collection Time Limit as 12, HP XP P9000Watch will create 12 new files, each containing performance data for an hour’s time.
4 Viewing performance metrics in HP XP P9000Watch This section describes how to collect the performance data of the XP and the P9000 disk arrays and view the performance metrics using HP XP P9000Watch. Collecting performance metrics This section describes how to collect performance data of the XP and the P9000 disk arrays using HP XP P9000Watch. The Array menu appears after you invoke HP XP P9000Watch. To collect the performance data of the XP and the P9000 disk arrays: 1. Start HP XP P9000Watch. 2.
3. 4. Select the required port. Enter the c command. The Pick LDEVs/RAID Groups Selection Scheme appears. • Filtering LDEVs by RAID Groups Follow this procedure to filter LDEVs by RAID groups: a. Enter 1 to select this option. The RAID groups within the host groups are displayed. b. Select the required RAID groups. c. Enter the c command. The LDEVs within the RAID groups are displayed. d. Select the required LDEVs. e. Enter the c command.
• Skip and start collecting Follow this procedure to skip all the selection process and collect performance data for all the ports: a. Enter 4 to select this option. The following message appears: Would you like to archive the performance data collected? (Y/N) b. Enter Y to save the performance data in .CSV format. The Output screen appears. NOTE: The Output screen displays performance data of all selected ports and processors belonging to the selected XP or P9000 disk arrays. c.
Sync/Async Metrics The Sync/Async Metrics provides the configuration data of the selected P-VOLs and S-VOLs in the disk array. In addition, it includes performance metrics of the following components: • LDEVs configured as P-VOLs or S-VOLs. • Continuous access ports configured for the synchronous or asynchronous communication. The performance data is displayed for all the continuous access ports irrespective of whether you view the Sync/Async metrics or the CA Journal metrics.
Table 12 P-VOL S-VOL Configuration (continued) Configuration data Description CLPR CLPR associated with the P-VOL or S-VOL. Port Port that establishes communication between the host and P-VOL or S-VOL. P-VOL S-VOL LDEV performance metrics Table 13 (page 42) describes the performance metrics of P-VOLs and S-VOLs. Table 13 P-VOL S-VOL LDEV performance metrics Performance metrics Unit Description LDEV number Logical Device name. RG number RAID group identifier.
Table 14 PVOL SVOL RAID Group performance metrics (continued) Performance metrics Unit Description Wr% % Average Write percentage. Seq% % Average Sequential I/O percentage. r_H% % Average Read Cache Hit percentage. kB/IO KB/IO Average I/O size. KB/s KB/s Average Throughput. ms ms Average I/O Response time within back-end array. r_ms ms Average Read Response time. w_ms ms Average Write Response time. ms^ ms Maximum of (Maximum Read Response time and Maximum Write Response time).
Table 16 P-VOL S-VOL Ports performance metrics Performance metrics Unit Description Port number Port name. Slot string Slot number. Mode string Communication mode configured for the port, can be a MCU or RCU. MCU refers to the Master port that is configured to send I/Os to the RCU (Receiver port) residing on the remote data center disk array. RCU is configured to only receive I/Os from the MCU residing on the remote data center disk array.
Figure 21 CA Journal Performance Metrics For description of performance metrics related to P-VOLs, S-VOLs, and associated RAID groups, ports, CLPRs, see “Sync/Async Metrics” (page 41). The following sections describe the performance metrics related to journal groups, journal volumes, and associated RAID groups, CLPRs. JNL (Journal Group) metrics Table 17 (page 45) describes the performance metrics of journal group associated with the P-VOLs and S-VOLs that belong to the selected CTG.
Table 17 JNL metrics (continued) Performance metrics Unit Description • PJSN: P-VOL Journal Suspend Normal • PJNF: P-VOL Journal Normal Full • PJSF: P-VOL Journal Suspend Full • PJSE: P-VOL Journal Suspend Error, including Link failure Jid% % Utilization of the journal group. Q-Cnt number Number of remaining Q-Markers within the journal data. Q-Mrk number Latest sequence # for writing to the P-VOLs consistency group at the PAIR state. LD%^ % Utilization of the LDEVs in the journal group.
Figure 22 shows the Output screen for an XP disk array. Figure 22 Output screen for a XP disk array Figure 23 shows the Output screen for a P9000 disk array.
Figure 23 Output screen for a P9000 disk array Array Performance Metrics Table 14 describes the Array performance metrics.
Table 19 Host Group performance metrics Performance metrics Unit Description Host Group string Host Group name Avg IO number Average Front-end I/O per second over the collection update interval, which is set to a default value of 10 seconds. Avg MB MB/s Average throughput over the collection update interval, which is set to a default value of 10 seconds. Port performance metrics Table 20 describes the Port performance metrics.
Table 21 LDEV performance metrics (continued) Performance metrics Unit Description r_ms ms Average Read Response time w_ms ms Average Write Response time ms^ ms Maximum of (Maximum Read Response time and Maximum Write Response time) r_ms^ ms Maximum Read Response time w_ms^ ms Maximum Write Response time FeD number Front-end I/O Density [IOPS/GB] Be/Fe number Back-end/Front-end I/O ratio LD% % Average LDEV I/O utilization Be number Back-end I/O RAID group performance metrics Ta
CPU performance metrics Table 23 describes the CPU performance metrics. Table 23 CPU performance metrics Performance metrics Unit Description Ser number Serial number of the array Slot string CH slot number. For P9000 disk arrays, the slot refers to the MP blade location. Figure 23 shows the slots are shown as MA and MP Type string CH PCB type (Fibre/SCSI/DKA). For P9000 disk arrays, the type is displayed as MPPK.
DKC performance metrics Table 24 describes the DKC performance metrics.
5 Introduction to HP XP P9000Sketch This section gives an overview of HP XP P9000Sketch. Overview HP XP P9000Sketch is a tool provided by HP to enable you to view the performance metrics of different components of an XP or a P9000 disk array in a graphical format. The performance metrics obtained on monitoring the selected XP or the P9000 disk array’s host groups, ports, LDEVs, RAID, CPU, and DKC Groups including the array level metrics for a specified duration are stored in seven comma-separated files (.
6 Installing HP XP P9000Sketch This chapter lists the supported environment for HP XP P9000Sketch (previously called XPSketch) and describes the installation for HP XP P9000Sketch. Supported Windows platforms For information on the list of supported platforms, see the latest HP XP P9000 Performance Advisor Software OS Support Matrix available at www.hp.com/go/PerformanceAdvisor-support-docs. NOTE: • Use Microsoft Internet Explorer (IE) 7.0 when using Windows 2008 and IE 6.
NOTE: When you double-click Run.bat, sometimes HP XP P9000Sketch might not start immediately, or might appear and disappear immediately. This is because the system searches for the JRE files that are required to start HP XP P9000Sketch. By default, the JRE path is automatically set. However, to verify the path, complete the following steps: a. On your system, right-click My Computer, and select Properties from the pop-up menu that appears. b. On the System Properties window, click the Advanced tab. c.
7 Viewing performance metrics in HP XP P9000Sketch This section describes loading the .csv files, setting the Java heap size value, and viewing performance metrics in HP XP P9000Sketch. Loading the Comma separated file The performance metrics obtained on monitoring the selected XP or the P9000 disk array’s host groups, ports, LDEVs, RAID, CPU, and DKC groups including the array level metrics for a specified duration are stored in seven .csv files, one file for each component. The .
for viewing, more is the memory required for plotting the numerous data points from the selected metrics. Figure 24 shows the error message that is displayed when the metric count in the .csv file is higher compared to the Java heap size value specified in run.bat. Figure 24 Error message NOTE: • Ensure that the size of the CSV file to be loaded is not more than the configured heap size. • The maximum Java heap size that can be configured depends on the operating system specification.
Figure 25 Performance report generated using HP XP P9000Sketch You can select multiple metrics at a time. Accordingly, multiple graphs are plotted in the Graph Area, as shown in figure below. This is especially useful when you want to analyze the performance metrics of components across different time intervals. Different color codes are used to differentiate the various metrics when they are plotted in the Graph Area.
Figure 26 Multiple graphs plotted for multiple metric selection You can also view the Metrics Available, Samples Available, and Samples Displayed data for the CSV file that is currently loaded in HP XP P9000Sketch. Point to a location on the Metrics label, as shown in Figure 27. Figure 27 shows the available metrics and samples displayed on the screen.
Table 25 Array Group performance metrics Performance metrics Unit Description Array Number The array for which the performance is displayed MinIO IO/s Minimal I/O rate of the last 60 seconds MaxIO IO/s Maximum I/O rate of the last 60 seconds AvgIO IO/s Average I/O rate of the last 60 seconds MinMB MB/s Minimal throughput of the last 60 seconds MaxMB MB/s Maximum throughput of the last 60 seconds AvgMB MB/s Average throughput of the last 60 seconds Table 23 describes the Host Group pe
Table 28 LDEV performance metrics (continued) Performance Metrics Description Back-end to Front-end IO ratio [%] Back-end / Front-end I/O ratio LDEV Utilization % for LDEV Average LDEV I/O utilization Cache lines staged/destaged [1/s] Back-end I/O r_ms [ms] Average Read Response time w_ms [ms] Average Write Response time ms^ [ms] Maximum of (Maximum Read Response time and Maximum Write Response time) r_ms^ [ms] Maximum Read Response time w_ms^ [ms] Maximum Write Response time Table 29 desc
Table 30 CPU performance metrics (continued) Performance Metrics Description Utilization for MP 4 0[1/s] CHA PCB Busy Time for CPU 4(if installed) Utilization for MP 5 0[1/s] CHA PCB Busy Time for CPU 5(if installed) Utilization for MP 6 0[1/s] CHA PCB Busy Time for CPU 6(if installed) Utilization for MP 7 0[1/s] CHA PCB Busy Time for CPU 7(if installed) Table 31 describes the DKC performance metrics.
Table 33 JNL performance metrics (continued) Performance Metrics Description Ldev Utilization Percentage [%] JID# Ldev Utilization Percentage [%] JID# Raid Group Utilization Percentage [%] JID# Raid Group Utilization Percentage [%] JID# Understanding performance metrics in HP XP P9000Sketch 63
8 Working with charts in HP XP P9000Sketch This section describes viewing, modifying, saving, and printing charts in HP XP P9000Sketch. It also describes restoring the auto range settings on the chart. Viewing charts You can zoom in or zoom out on a chart on either the Domain Axis, Range Axis, or both. To zoom in, on the Options menu, point to Zoom In and select one of the following options: • Both— Select this option if you want to zoom in on both Domain Axis and the Range Axis.
NOTE: menu. 2. You can also right-click anywhere the chart, and select Properties from the pop-up On the Chart Properties window, you can modify the following: • • Under the Title tab: ◦ Change the chart title, font type, and color settings. ◦ Clear the Show Title check box if you do not want the chart title to be displayed. Under the Plot tab: ◦ Go to Appearance tab to change the appearance and orientation of the chart.
A HP XP P9000Watch use case scenarios Scenario 1: Port I/O spike Business case Periodic port I/O spikes are observed in P9000 Performance Advisor. Objective Locate the offending host group/application. Resolution HP XP P9000Watch can be used to find the hot spot by collecting the performance data for very short intervals, such as, 10 seconds. Perform the following steps to find the hot spot: 1. Select the affected port (You can find the affected port using HP XP P9000 Performance Advisor). 2.
Results By studying the HP XP P9000Watch metrics, you can analyze the amount of load on the XP or the P9000 disk array and the response time for I/Os from the host. This data can be correlated with the application performance.
B Understanding write ratio in HP XP P9000Watch The following screen shows the performance of the entire RAID group01-04 being collected with the performance of LDEVs 01:6c, 01:6d, 02:a3, 02:a4, and 02:a5. The LDEVs in RAID group 01-04 are exposed only throughx port 1A. There are no I/O activities or LDEVs reported on this port because there is no I/O activity in port 1A and these LDEVs are not visible through any other port.
C Relationship between LDEV I/O response time and Write ratio We cannot establish a relationship between the LDEV I/O response time and Write ratio because: • LDEV I/O response time is dependent on both front-end reads and front-end writes. • Write ratio provides only the write percentage in the I/Os. NOTE: The LDEV I/O response time shown by HP XP P9000Watch is the average I/O response time measured in milliseconds (that is, both reads and writes together are responsible for variations in this value).
D Comparing LDEV response time metrics in HP XP P9000 Performance Advisor and HP XP P9000Watch Maximum values of LDEV response time in HP XP P9000 Performance Advisor and HP XP P9000Watch The maximum values of LDEV response time in P9000 Performance Advisor cannot be compared with the response time values in HP XP P9000Watch because HP XP P9000 Performance Advisor displays the I/O response time as separate metrics for read and write, respectively.
9 Support and other resources Contacting HP HP technical support For world wide technical support information, see the HP support website: http://www.hp.
Websites • HP.com http://www.hp.com • HP Storage http://www.hp.com/go/storage • HP Manuals http://www.hp.com/support/manuals • HP download drivers and software http://www.hp.com/support/downloads • HP Software Depot http://www.software.hp.
Typographic conventions Table 34 Document conventions Convention Element Blue text: Table 34 (page 73) Cross-reference links and email addresses Blue, underlined text: http://www.hp.
Glossary A Array Control Processor (ACP) ACP is used in the XP disk arrays prior to the XP24000 Disk Array. With the introduction of the XP24000 Disk Array, the DKA has replaced ACP. The DKA is also applicable for the P9000 disk arrays. ACP handles the transfer of data between the cache and the physical drives held in the DKUs. The ACPs work in pairs, providing a total of eight SCSI buses. Each SCSI bus associated with one ACP is paired with a SCSI bus on the other ACP pair element.
Continuous Access Journal (Cnt Ac-J) Continuous Access Journal Software is an asynchronous mirroring program similar to the Continuous Access Asynchronous, except that the transactions to be written to the secondary disk array are maintained in a disk-based journal file. This provides better performance for the secondary disk array systems that are not highly available or that may be subject to bandwidth contention from other applications.
H HDD Hard Disk Drive Hewlett-Packard Authorization Center (HPAC) The Hewlett-Packard Authorization Center license key website (http://webkey.external.hp.com/), where you generate a license for a specified internal raw disk capacity of your XP disk array or the usable capacity of your P9000 disk array. Host Group A group of hosts that belong to a particular WWN group. I IP version 6 (IPv6) The IPv6 is a new version of the Internet Protocol, which is a successor to the IP version 4 (IPv4).
RAID Manager Library (RML, RMLIB) The RAID Manager Library is an API library that enables third-party software products to directly operate some of the functions on the P9000 and XP disk arrays. Read/Write (R/W) Read-write access. S S-VOL Secondary or remote volume. The copy volume that receives the data from the primary volume. SAN Storage area network. A network of storage devices available to one or more servers.
Index A Archival Frequency, 37 Array menu, 20 Average read response time, 70 write percentage, 68 write response time, 70 C Collection Update Interval, 37 conventions document, 73 text symbols, 73 D Data Collection Time Limit, 37 Data Split Time, 37 document conventions, 73 prerequisites, 71 related documentation, 71 documentation providing feedback, 71 F feedback documentation, 71 H help obtaining, 71 Host Groups clearing host groups, 28 screen, 25 selecting host groups, 26 viewing host groups, 26 HP t
R RAID group Filtering RAID groups by LDEVs, 39 menu, 33 performance metrics, 50 Real-Time Monitor Size, 37 related documentation, 71 S Subscriber's choice, HP, 71 symbols in text, 73 T technical support HP, 71 service locator website, 72 text symbols, 73 W websites HP , 72 HP Subscriber's choice for business, 71 79