
XPWatch and XPSketch Reference guide for HP XP P9000 Performance Advisor
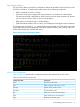
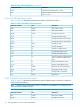
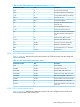
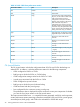
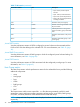
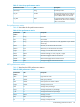
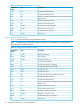

Table 17 JNL metrics (continued)
DescriptionUnitPerformance metrics
• PJSN: P-VOL Journal Suspend
Normal
• PJNF: P-VOL Journal Normal Full
• PJSF: P-VOL Journal Suspend Full
• PJSE: P-VOL Journal Suspend Error,
including Link failure
Utilization of the journal group.%Jid%
Number of remaining Q-Markers within
the journal data.
numberQ-Cnt
Latest sequence # for writing to the
P-VOLs consistency group at the PAIR
state.
numberQ-Mrk
Utilization of the LDEVs in the journal
group.
%LD%^
Utilization of the RAID groups in the
journal group.
%RG%^
Journal LDEV metrics
View the performance metrics of LDEVs configured as journal volumes and associated with the
P-VOLs and S-VOLs that belong to the selected CTG. For more information, see Table 13 (page
42).
Journal RAID Group metrics
View the performance metrics of RAID groups to which the configured journal volumes belong. For
more information, see Table 14 (page 42).
Journal CLPR metrics
View the performance metrics of CLPRs associated with the configured journal groups. For more
information, see Table 15 (page 43).
Host Group metrics
The Host Group metrics include performance metrics for the selected disk array and the following
additional components:
• Array
• Host groups
• Ports
• LDEVs
• RAID groups
• CPU
• DKC
The Output screen and the seven output files .csv files that are generated, one file for each
component, contain performance metrics pertaining to host groups, ports, LDEVs, RAID groups,
CPU, DKC, and Array utilization of the selected XP or P9000 disk arrays.
NOTE: Array and Host Group Level metrics displayed are based on the selected Ports and LDEVs
respectively.
46 Viewing performance metrics in HP XP P9000Watch