
XPWatch and XPSketch Reference guide for HP XP P9000 Performance Advisor
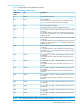
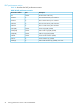
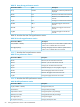

Table 25 Array Group performance metrics
DescriptionUnitPerformance metrics
The array for which the performance is
displayed
NumberArray
Minimal I/O rate of the last 60 secondsIO/sMinIO
Maximum I/O rate of the last 60
seconds
IO/sMaxIO
Average I/O rate of the last 60 secondsIO/sAvgIO
Minimal throughput of the last 60
seconds
MB/sMinMB
Maximum throughput of the last 60
seconds
MB/sMaxMB
Average throughput of the last 60
seconds
MB/sAvgMB
Table 23 describes the Host Group performance metrics.
Table 26 Host Group performance metrics
DescriptionPerformance Metrics
Average Front-end I/Os over the collection update interval,
which is set to a default value of 10 seconds.
IOPs (TotalRd + TotalWr)
Average Throughput over the collection update interval,
which is set to a default value of 10 seconds.
Throughput [MB/s]
Table 27 describes the Port performance metrics.
Table 27 Port performance metrics
DescriptionPerformance Metrics
Minimal I/O rate of the last 60 secondsMinIO
Maximum I/O rate of the last 60 secondsMaxIO
Average I/O rate of the last 60 secondsAvgIO
Calculate average I/O size (=avgKB / avgI/O)KB/IO
Minimal throughput of the last 60 secondsMinKB
Maximum throughput of the last 60 secondsMaxKB
Average throughput of the last 60 secondsAvgKB
Table 28 describes the LDEV performance metrics.
Table 28 LDEV performance metrics
DescriptionPerformance Metrics
Average Front-end I/OsAvgIO (TotalRd + TotalWr)
Average Write percentageWrite Ratio %
Average Sequential I/O percentageSequential IO ratio %
Average Read Cache Hit percentageRead hits % for LDEV
Average ThroughputThroughput [KB/s]
Average I/O Response TimeIO response time [ms]
60 Viewing performance metrics in HP XP P9000Sketch