
Hitachi Dynamic Link Manager Software Users Guide for Windows (7.6)

A system memory dump file is a file to which the system memory data is
output when a Windows system is down. Specify the following procedure to
output the system memory dump file.
Click Control Panel, System, Startup/Shutdown, Write Debugging
Information is chosen with Recovery, and then choose Kernel Memory
Dump or Complete Memory Dump.
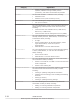
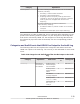
The following table lists and describes the error information that can be
collected in logs.
Table 2-7 Types of Error Information
Log name Description Output destination
Integrated trace
file
Operation logs for the HDLM
commands and HDLM GUI
The default file path is drive-for-
program-installation:\Program
Files
#1
\HITACHI
\HNTRLib2\spool\hntr2n.log
(n indicates a file number)
To specify the output destination
folder and the file prefix for the
integrated trace file, use a
Hitachi Network Objectplaza
Trace Library (HNTRLib2) utility.
Trace file Trace information on the HDLM
manager is collected at the level
specified by the user. If an error
occurs, you might need to change
the settings to collect trace
information.
The trace file name is
\Program Files\HITACHI
\DynamicLinkManager\log
\hdlmtr[1-64].log
#2
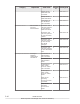
Error log Error information is collected for the
user-defined level. By default,
HDLM collects all error information.
HDLM Manager logs:
\Program Files\HITACHI
\DynamicLinkManager\log
\dlmmgr[1-16].log
#2
HDLM GUI logs:
\Program Files\HITACHI
\DynamicLinkManager\log
\dlmgui[1-2].log
#2
Hitachi Command Suite Common
Agent Component logs:
\Program Files\HITACHI
\DynamicLinkManager\log
\dlmwebagent[1-n].log
#2
The value n depends on a
setting in the file
dlmwebagent.properties.
Event log Information about very severe
errors (a severity level of Critical
or Error) is collected.
You can use administrative tools
such as Event Viewer to check these
event logs.
Event log (application log)
#1
HDLM Functions
2-35
Hitachi Dynamic Link Manager User Guide for Windows
®