
User Manual


(which was leaning even then) and timed its descent by counting his pulse. The
following data are measurements Galileo might have made.
t (pulses)
2 2.5 3.5 4 4.5
h (feet)
30 50 90 130 150
Find the power curve formulas that best expresses h as a function of t (h = At
B
).
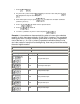
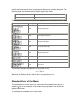
Keystrokes Display
CLEAR
30
2
1.00 First pair data input.
50
2.5
2.00 Second pair data input.
90
3.5
3.00 Third pair data input.
130
4
4.00 Fourth pair data input.
150
4.5
5.00 Fifth pair data input.
1.00
Correlation coefficient (between ln y and ln x).
0
7.72
Value of A.
1 0
1.99
Value of B.
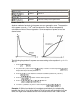
The formula that best expresses h as a function of t is
h = 7.72t
1.99
We know, as Galileo did not, that in fact h is proportional to t
2
.
Standard Error of the Mean
The standard error of the mean is a measure of how reliable the mean of a
sample ( ) is as an estimator of the mean of the population from which the
sample was drawn.
To calculate the standard error of the mean: