
Manual


Chapter 5 Monitoring
118
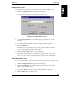
The Graph Data box allows you to see currently generated data from the
selected server (Present) or previously saved data (Past) from the buffer or
from a data file selected within the Settings page.
Pausing/Resuming the Data Display
To pause (or resume) the data display, do the following:
• Click the Pause (or Resume, if previously paused) button. See Figure 5-20.
Changing Graph Options
To change Graph Options for a particular analysis string, refer to the following
procedure.
1. Select the analysis string of interest in the display window. See
Figure 5-20.
2. Click Graph Options button.
◊ Select Visible to view the string’s data.
◊ Select Autoscale to automatically scale the data along the Y-axis, the
Y-axis multiplier, and Y offset.
NOTE If you want to compare data from different analysis strings, the
Y multiplier and Y offset settings should be the same.
Exiting the Line Graph Tab
To exit from Line Graph page in Statistic View, do one of the following:
• Click Close to exit from Statistics View.
• Or, click another Statistics View tab.