
Manual


The discovery and state monitoring provides the latest HP server inventory and state results to the
SCOM console. This monitoring displays a near realtime state of the HP server and provides the
state of each hardware subsystem (collection) down to the HP Health Collection level. Because HP
Health Collections are subsystem levels of information, they do not present detailed component-level
information. To get the detailed information, launch the HP System Management Homepage (SMH)
console task.
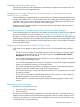
NOTE: HP recommends working through SMH after initially starting the management of HP
servers if there are yellow or red states in the HP Server class.
Event monitoring provides the best possible information for failed descriptions and failed
components. If event monitoring generates an alert on the SCOM console, you must resolve the
issue immediately. Events are generated only once. If a state change was observed, look at the
Active Alerts view to find detailed information about the issue.
HP Health Collection state monitoring and failed component information
HP Health Collection is monitored with its health state and failed component information. The detail
level of the failed component information depends on the type of collection. The failed component
information can be found using the Health Explorer.
Failed component information is updated only when it is associated with a state-level change.
When warning or error states change, failed component information appears. However, Operations
Manager Agents report the state history only when there is a state-level change. If there are multiple
component failures, but they are not associated with a state-level change, failed component
information is not accurate. There is an alert associated to a new warning or error event. Check
the Active Alerts first, and then launch the HP System Management Homepage task to drill down
further.
Health Explorer shows a healthy status for disabled software services
When a software service is disabled, the Health Explorer shows the state of this service as Healthy
instead of Not Monitored. For example, when the HP Insight Event Notifier service is disabled,
the Health Explorer displays this service with a green status icon.
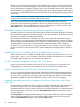
No HP ProLiant server appears in any DL, BL, or ML group
Legacy HP ProLiant servers that do not fit in the DL, BL, or ML groups are not supported in this
management pack. These servers are displayed in the HP ProLiant Servers Diagram View.
System is discovered as an HP ProLiant server but is not monitored
HP servers are monitored based on information provided by the HP Insight Management Agents
or the HP Insight Management WBEM Providers. If the server is discovered and identified as an
HP server, but is not monitored, verify that the HP Insight Management Agents or the HP Insight
Management WBEM Providers are installed and running on the server to be managed.
Expected associated classes do not appear in the Server State view or the Group
State view
The Group State view and Server State view may not display the expected associated class instances
by default. The layout of the view can be different according to the installation order of the
management packs, the discovery results, and the user's console configuration. To include associated
classes and properties in each view, open the Personalize View dialog box and select the ones
you want included.
The Group State view displays the Path property as always empty. All Group classes are singleton
classes with no Path property. If you want to hide the Path property from the Group State view,
open the Personalize View dialog box and clear the Path property.
80 Troubleshooting