
- Hewlett-Packard Switch User Manual


Table Of Contents
- HP ProCurve 2520 Switches Management and Configuration Guide
- Front Cover
- Title Page
- Copyright, Notices, & Publication Data
- Contents
- Feature Index
- 1.Getting Started
- 2.Selecting a Management Interface
- 3.Using the Menu Interface
- 4.Using the Command Line Interface (CLI)
- 5.Using the ProCurve Web Browser Interface
- 6.Switch Memory and Configuration
- 7.Interface Access and System Information
- 8.Configuring IP Addressing
- 9.Time Protocols
- 10.Port Status and Configuration
- Contents
- Overview
- Viewing Port Status and Configuring Port Parameters
- Menu: Port Status and Configuration
- CLI: Viewing Port Status and Configuring Port Parameters
- Customizing the Show Interfaces Command
- Viewing Port Utilization Statistics
- Viewing Transceiver Status
- Enabling or Disabling Ports and Configuring Port Mode
- Enabling or Disabling Flow Control
- Configuring a Broadcast Limit on the Switch
- Configuring ProCurve Auto-MDIX
- Web: Viewing Port Status and Configuring Port Parameters
- Using Friendly (Optional) Port Names
- 11.Power Over Ethernet (PoE) Operation
- 12.Port Trunking
- Contents
- Overview
- Port Trunk Features and Operation
- Trunk Configuration Methods
- Menu: Viewing and Configuring a Static Trunk Group
- CLI: Viewing and Configuring Port Trunk Groups
- Web: Viewing Existing Port Trunk Groups
- Trunk Group Operation Using LACP
- Trunk Group Operation Using the “Trunk” Option
- How the Switch Lists Trunk Data
- Outbound Traffic Distribution Across Trunked Links
- 13.Configuring for Network Management Applications
- Contents
- Using SNMP Tools To Manage the Switch
- LLDP (Link-Layer Discovery Protocol)
- Terminology
- General LLDP Operation
- Packet Boundaries in a Network Topology
- Configuration Options
- Options for Reading LLDP Information Collected by the Switch
- LLDP and LLDP-MED Standards Compatibility
- LLDP Operating Rules
- Configuring LLDP Operation
- LLDP-MED (Media-Endpoint-Discovery)
- Displaying Advertisement Data
- LLDP Operating Notes
- LLDP and CDP Data Management
- A.File Transfers
- B.Monitoring and Analyzing Switch Operation
- Contents
- Overview
- Status and Counters Data
- Menu Access To Status and Counters
- General System Information
- Task Monitor—Collecting Processor Data
- Switch Management Address Information
- Port Status
- Viewing Port and Trunk Group Statistics and Flow Control Status
- Viewing the Switch’s MAC Address Tables
- Spanning Tree Protocol (MSTP) Information
- Internet Group Management Protocol (IGMP) Status
- VLAN Information
- Web Browser Interface Status Information
- Interface Monitoring Features
- Locating a Device
- C.Troubleshooting
- Contents
- Overview
- Troubleshooting Approaches
- Browser or Telnet Access Problems
- Unusual Network Activity
- General Problems
- 802.1Q Prioritization Problems
- IGMP-Related Problems
- LACP-Related Problems
- Port-Based Access Control (802.1X)-Related Problems
- QoS-Related Problems
- Radius-Related Problems
- Spanning-Tree Protocol (MSTP) and Fast-Uplink Problems
- SSH-Related Problems
- TACACS-Related Problems
- TimeP, SNTP, or Gateway Problems
- VLAN-Related Problems
- Fan Failure
- Using the Event Log for Troubleshooting Switch Problems
- Debug/Syslog Operation
- Debug/Syslog Messaging
- Debug/Syslog Destination Devices
- Debug/Syslog Configuration Commands
- Configuring Debug/Syslog Operation
- Debug Command
- Logging Command
- Adding a Description for a Syslog Server
- Adding a Priority Description
- Configuring the Severity Level for Event Log Messages Sent to a Syslog Server
- Operating Notes for Debug and Syslog
- Diagnostic Tools
- Viewing Switch Configuration and Operation
- Restoring the Factory-Default Configuration
- Restoring a Flash Image
- DNS Resolver
- D.MAC Address Management
- E.Daylight Savings Time on ProCurve Switches
- F.Power-Saving Features
- Index
- Notices & Publication Data
Using the ProCurve Web Browser Interface
Status Reporting Features
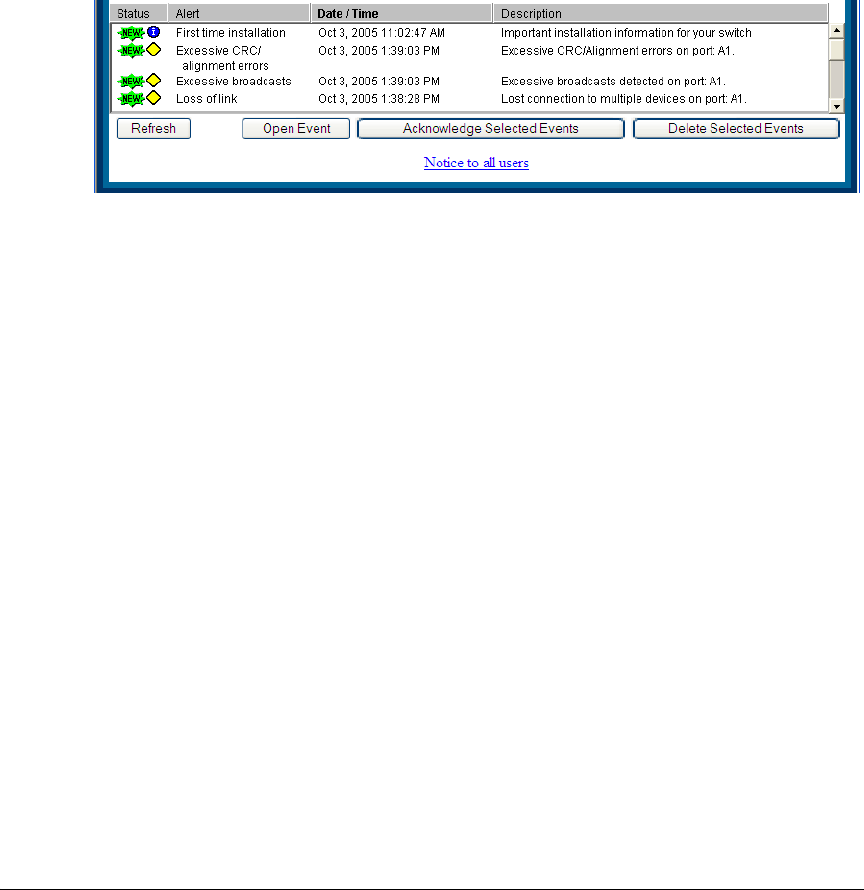
The Alert Log
The web browser interface Alert Log, shown in the lower half of the screen,
shows a list of network occurrences, or alerts, that were detected by the
switch. Typical alerts are Broadcast Storm, indicating an excessive number of
broadcasts received on a port, and Problem Cable, indicating a faulty cable. A
full list of alerts is shown in the table on page 5-21.
Figure 5-13. Example of the Alert Log
Each alert has the following fields of information:
■ Status – The level of severity of the event generated. Severity levels can
be Information, Normal, Warning, and Critical. If the alert is new (has not
yet been acknowledged), the New symbol is also in the Status column.
■ Alert – The specific event identification.
■ Date/Time – The date and time the event was received by the web
browser interface. This value is shown in the format: DD-MM-YY
HH:MM:SS AM/PM, for example, 16-Sep-99 7:58:44 AM.
■ Description – A short narrative statement that describes the event. For
example, Excessive CRC/Alignment errors on port: 8.
Sorting the Alert Log Entries
The alerts are sorted, by default, by the Date/Time field with the most recent
alert listed at the top of the list. The second most recent alert is displayed
below the top alert and so on. If alerts occurred at the same time, the
simultaneous alerts are sorted by order in which they appear in the MIB.
Bold characters in a column heading indicate that the alert field alert log
entries. You can sort by any of the other columns by clicking on the column
heading. The Alert and Description columns are sorted alphabetically, while the
Status column is sorted by severity type, with more critical severity indicators
appearing above less critical indicators.
5-20