
- Hewlett-Packard Switch User Manual


Table Of Contents
- HP ProCurve 2520 Switches Management and Configuration Guide
- Front Cover
- Title Page
- Copyright, Notices, & Publication Data
- Contents
- Feature Index
- 1.Getting Started
- 2.Selecting a Management Interface
- 3.Using the Menu Interface
- 4.Using the Command Line Interface (CLI)
- 5.Using the ProCurve Web Browser Interface
- 6.Switch Memory and Configuration
- 7.Interface Access and System Information
- 8.Configuring IP Addressing
- 9.Time Protocols
- 10.Port Status and Configuration
- Contents
- Overview
- Viewing Port Status and Configuring Port Parameters
- Menu: Port Status and Configuration
- CLI: Viewing Port Status and Configuring Port Parameters
- Customizing the Show Interfaces Command
- Viewing Port Utilization Statistics
- Viewing Transceiver Status
- Enabling or Disabling Ports and Configuring Port Mode
- Enabling or Disabling Flow Control
- Configuring a Broadcast Limit on the Switch
- Configuring ProCurve Auto-MDIX
- Web: Viewing Port Status and Configuring Port Parameters
- Using Friendly (Optional) Port Names
- 11.Power Over Ethernet (PoE) Operation
- 12.Port Trunking
- Contents
- Overview
- Port Trunk Features and Operation
- Trunk Configuration Methods
- Menu: Viewing and Configuring a Static Trunk Group
- CLI: Viewing and Configuring Port Trunk Groups
- Web: Viewing Existing Port Trunk Groups
- Trunk Group Operation Using LACP
- Trunk Group Operation Using the “Trunk” Option
- How the Switch Lists Trunk Data
- Outbound Traffic Distribution Across Trunked Links
- 13.Configuring for Network Management Applications
- Contents
- Using SNMP Tools To Manage the Switch
- LLDP (Link-Layer Discovery Protocol)
- Terminology
- General LLDP Operation
- Packet Boundaries in a Network Topology
- Configuration Options
- Options for Reading LLDP Information Collected by the Switch
- LLDP and LLDP-MED Standards Compatibility
- LLDP Operating Rules
- Configuring LLDP Operation
- LLDP-MED (Media-Endpoint-Discovery)
- Displaying Advertisement Data
- LLDP Operating Notes
- LLDP and CDP Data Management
- A.File Transfers
- B.Monitoring and Analyzing Switch Operation
- Contents
- Overview
- Status and Counters Data
- Menu Access To Status and Counters
- General System Information
- Task Monitor—Collecting Processor Data
- Switch Management Address Information
- Port Status
- Viewing Port and Trunk Group Statistics and Flow Control Status
- Viewing the Switch’s MAC Address Tables
- Spanning Tree Protocol (MSTP) Information
- Internet Group Management Protocol (IGMP) Status
- VLAN Information
- Web Browser Interface Status Information
- Interface Monitoring Features
- Locating a Device
- C.Troubleshooting
- Contents
- Overview
- Troubleshooting Approaches
- Browser or Telnet Access Problems
- Unusual Network Activity
- General Problems
- 802.1Q Prioritization Problems
- IGMP-Related Problems
- LACP-Related Problems
- Port-Based Access Control (802.1X)-Related Problems
- QoS-Related Problems
- Radius-Related Problems
- Spanning-Tree Protocol (MSTP) and Fast-Uplink Problems
- SSH-Related Problems
- TACACS-Related Problems
- TimeP, SNTP, or Gateway Problems
- VLAN-Related Problems
- Fan Failure
- Using the Event Log for Troubleshooting Switch Problems
- Debug/Syslog Operation
- Debug/Syslog Messaging
- Debug/Syslog Destination Devices
- Debug/Syslog Configuration Commands
- Configuring Debug/Syslog Operation
- Debug Command
- Logging Command
- Adding a Description for a Syslog Server
- Adding a Priority Description
- Configuring the Severity Level for Event Log Messages Sent to a Syslog Server
- Operating Notes for Debug and Syslog
- Diagnostic Tools
- Viewing Switch Configuration and Operation
- Restoring the Factory-Default Configuration
- Restoring a Flash Image
- DNS Resolver
- D.MAC Address Management
- E.Daylight Savings Time on ProCurve Switches
- F.Power-Saving Features
- Index
- Notices & Publication Data
Using the ProCurve Web Browser Interface
Status Reporting Features
Status Reporting Features
Browser elements covered in this section include:
■ The Overview window (below)
■ Port utilization and status (page 5-17)
■ The Alert log (page 5-20)
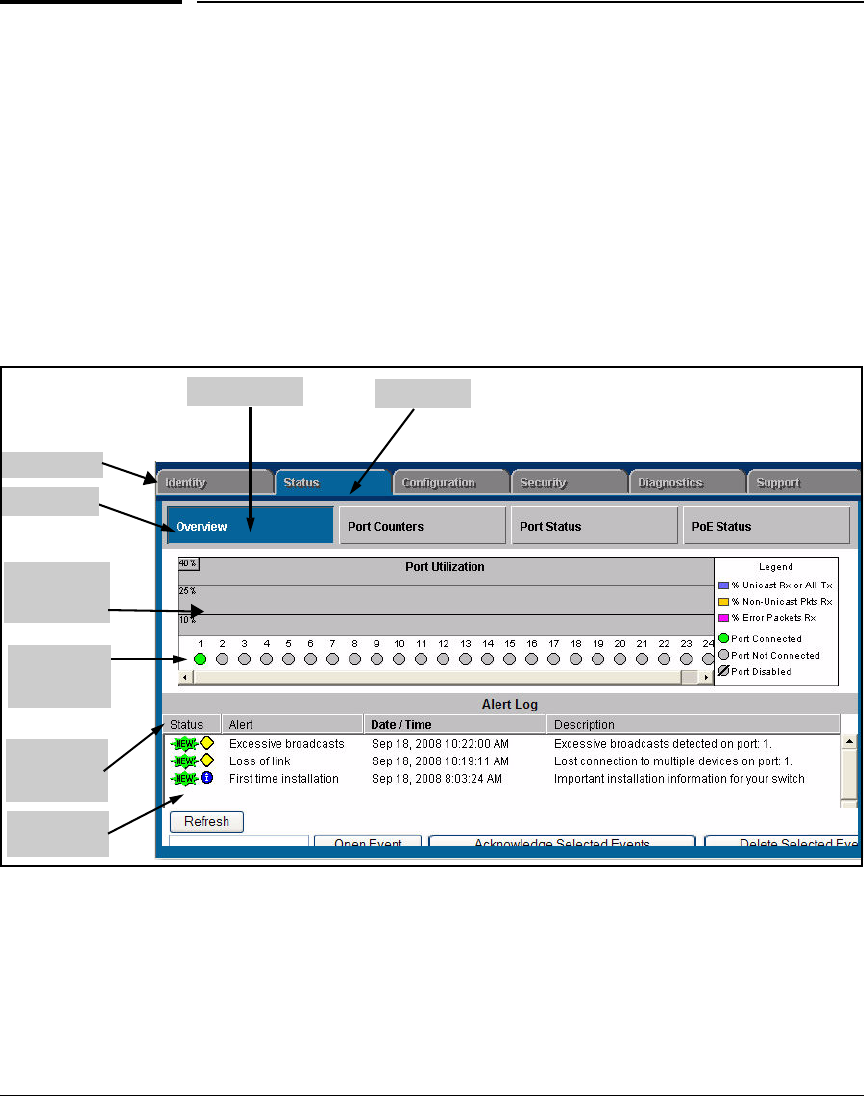
The Overview Window
The Overview Window is the home screen for any entry into the web browser
interface.The following figure identifies the various parts of the screen.
Active Button
Active Tab
Alert Log
Control Bar
Port Utiliza-
tion Graphs
(page 5-17)
Alert Log
(page 5-20)
Port Status
Indicators
(page 5-19)
Button Bar
Tab Bar
Figure 5-8. The Status Overview Window
Policy Management and Configuration. PCM can perform network-wide
policy management and configuration of your switch. The Management Server
URL field (page 5-13) shows the URL for the management station performing
that function. For more information, refer to the documentation provided with
the PCM software.
5-16