user's guide version 3.0 advanced performance monitoring www.hp.
Notice Safety notices © Hewlett-Packard Company, 2001. All rights reserved. Any servicing, adjustment, maintenance, or repair must be performed only by authorized service-trained personnel. Edition: E1201 Hewlett-Packard Company makes no warranty of any kind with regard to this material, including, but not limited to, the implied warranties of merchantability and fitness for a particular purpose.
Contents Preface Chapter 1 Chapter 2 About This Guide . . . . . . . . . . . . . . . . . . . . . . . . . . . . . . . . . . . . . . . . . . v Related Publications . . . . . . . . . . . . . . . . . . . . . . . . . . . . . . . . . . . . . . . . v Getting Help . . . . . . . . . . . . . . . . . . . . . . . . . . . . . . . . . . . . . . . . . . . . . vii Getting Software Updates. . . . . . . . . . . . . . . . . . . . . . . . . . . . . . . . . . . .
Chapter 3 Using Advanced Performance Monitoring Overview. . . . . . . . . . . . . . . . . . . . . . . . . . . . . . . . . . . . . . . . . . . . . . . . . 3-1 Web Tools . . . . . . . . . . . . . . . . . . . . . . . . . . . . . . . . . . . . . . . 3-1 Telnet Commands . . . . . . . . . . . . . . . . . . . . . . . . . . . . . . . . . 3-1 AL_PA Performance Monitoring . . . . . . . . . . . . . . . . . . . . . . . . . . . . . . 3-2 Displaying the CRC Error Count . . . . . . . . . . . . . . . . . . . . .
Preface Advanced Performance Monitoring is a licensed option and requires a valid license key to function. It is included and enabled in switches with the performance upgrade option. It is supported for the HP Surestore FC 1Gb/2Gb Entry Switch 8B, FC 1Gb/2Gb Switch 8B and FC 1Gb/2Gb Switch 16B using Fabric OS version 3.0.1b or later.
Provided on the FC Entry Switch 8B and FC Switch 8B Documentation CD, and at the HP Web site at http://www.hp.com/support/fc8B: • • • • • • • • • • • • • • HP Surestore FC 1Gb/2Gb Entry Switch 8B and FC 1Gb/2Gb Switch 8B Getting Started Guide (A7346-90902) HP Surestore FC 1Gb/2Gb Entry Switch 8B and FC 1Gb/2Gb Switch 8B Installation and Reference Guide Fabric OS Reference Manual, version 3.0 Fabric OS Procedures Guide, version 3.0 Fabric OS Version 3.0.
Getting Help For information for the FC Entry Switch 8B and FC Switch 8B, visit the HP Web site at http://www.hp.com/support/fc8B. For the most current technical support information for the FC 16B, visit the HP Web site at http://www.hp.com/support/fc16B. This includes hardware and software support, all repairs, and spare components.
viii Advanced Performance Monitoring User’s Guide
Chapter Introducing Advanced Performance Monitoring 1 This chapter provides the following information: • • • Overview on page 1-1 Performance Monitoring with Telnet Commands on page 1-2 Performance Monitoring with Web Tools on page 1-3 Overview Advanced Performance Monitoring provides SAN performance management through an end-to-end monitoring system that enables you to: • • • • • • • Increase end-to-end visibility into the fabric Enable more accurate reporting for service level agreements and charg
1 Introducing Advanced Performance Monitoring If you have a fabric with HP Brocade 2400/2800, FC 6164, FC Entry Switch 8B, FC Switch 8B, or FC 16B switches, you can take advantage of the end-to-end performance monitoring features by installing an FC Entry Switch 8B, FC Switch 8B, or FC 16B switch anywhere in the route path between the Source ID and the Destination ID. You can administer performance monitoring through either telnet commands or Web Tools.
Introducing Advanced Performance Monitoring • 1 Fibre channel words that have been received by the port for the SID-DID pair Filter-based Monitoring Filter-based monitoring provides information about a filter’s hit count. Any pattern of values in the first 64 bytes of the Fibre Channel frame can be measured. The counter increases each time a frame is filtered through the corresponding port. Examples of port filter statistics that can be measured are: • • SCSI Read, Write, or Read/Write commands IP vs.
1 Introducing Advanced Performance Monitoring Figure 1-1 Accessing Predefined Performance Graphs User-defined Graphs The predefined graphs can be modified based on parameter fields such as SID/DID, LUN, AL_PA, and port. These new user-defined graphs can be added and saved to canvas configurations. Figure 1-2 shows a list of user-defined graphs defined in a canvas.
Introducing Advanced Performance Monitoring 1 Performance Graph Formats Performance graphs can be displayed as vertical bar charts, horizontal bar charts, and line charts, as shown in Figure 1-3. Vertical Bar Charts Horizontal Bar Charts Figure 1-3 Line Charts Types of Performance Graphs In addition to the above charts, the Advanced Performance Monitoring Resource Usage Display (shown in Figure 1-4 on page 1-6) shows which filter slots have been used for each port, and which are available.
1 Introducing Advanced Performance Monitoring Figure 1-4 Advanced Performance Monitoring Resource Usage Display Performance Graph Canvas The enhanced performance monitoring in Web Tools enables you to set up a canvas of performance graphs. The canvas can hold up to eight graphs per window, as shown in Figure 1-5 on page 1-7.
Introducing Advanced Performance Monitoring Figure 1-5 1 Canvas of Eight Performance Monitoring Graphs Multiple canvasses can be created for different users or different scenarios. You can then save the multiple configurations of graphs, edit them, and recall them. Figure 1-6 shows a list of different canvas configurations from which you can choose to display.
1 1-8 Introducing Advanced Performance Monitoring Advanced Performance Monitoring User’s Guide
Chapter Installing Advanced Performance Monitoring 2 This chapter provides the following information: • • • Overview on page 2-1 Installing Through Telnet on page 2-1 Installing through Web Tools on page 2-2 Overview To enable Advanced Performance Monitoring, you must install a license on each switch that will use this feature. For information on obtaining license keys for an FC Entry Switch 8B or FC Switch 8B, visit the HP Web site at http://www.hp.com/support/fc8B.
2 Installing Advanced Performance Monitoring where “key” is the license key exactly as provided by your switch supplier, surrounded by double quotes. The license key is case-sensitive and must be entered exactly as given. 4.
Installing Advanced Performance Monitoring 2 4. Select the License Admin tab. 5. Enter the license key in the License Key field exactly as provided by your switch supplier, and click Add (see Figure 2-2). The Advanced Performance Monitoring features are available as soon as the license is added. Figure 2-2 License Admin Tab For more information about Web Tools, see the Web Tools User’s Guide Version 3.0.
2 2-4 Installing Advanced Performance Monitoring Advanced Performance Monitoring User’s Guide
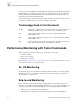
Chapter Using Advanced Performance Monitoring 3 This chapter provides the following information: • • • • • Overview on page 3-1 AL_PA Performance Monitoring on page 3-2 End-to-end Performance Monitoring on page 3-3 Filter-based Performance Monitoring on page 3-8 Saving and Restoring Monitor Configuration on page 3-12 Overview You can administer Advanced Performance Monitoring through telnet commands or through Web Tools (an optionally licensed product).
3 Using Advanced Performance Monitoring AL_PA Performance Monitoring AL_PA performance monitoring allows you to track and display the number of CRC errors that have occurred on frames sent to each AL_PA on a specific port. No monitor configuration is necessary for AL_PA performance monitoring. Displaying the CRC Error Count Use the perfShowAlpaCrc command to display the CRC error count for all AL_PA devices or a single AL_PA on a specific port. The port must be an active L_Port. Example 1.
Using Advanced Performance Monitoring 3 End-to-end Performance Monitoring End-to-end performance monitoring counts the number of words and CRC errors in Fibre Channel frames for a specified Source ID (SID) and Destination ID (DID) pair.
3 Using Advanced Performance Monitoring Monitor 0 counts the frames that have an SID of 0x051200 and a DID of 0x111eef. For monitor 0, RX_COUNT is the number of words from Host A to Dev B, CRC_COUNT is the number of frames from Host A to Dev B with CRC errors, and TX_COUNT is the number of words from Dev B to Host A. Monitor 1 counts the frames that have an SID of 0x111eef and a DID of 0x051200.
Using Advanced Performance Monitoring 3 Use the perfSetPortEEMask to set a mask for end-to-end monitors. The command sets the mask for all end-to-end monitors of a port, so that you can selectively choose the Fibre Channel frames in which the number of words are to be counted. The perfSetPortEEMask command sets a mask for the Domain ID, Area ID, and AL_PA of the SIDs and DIDs for frames transmitted from and received by the port. Figure 3-3 shows the mask positions in the command.
3 Using Advanced Performance Monitoring Displaying the End-to-end Mask of a Port Use the perfShowPortEEMask command to display the current end-to-end mask of a port. The end-to-end mask has 12 fields, with each field having a value of on or off. Example. The following commands set an end-to-end mask on port 11 and display the mask: sw1:admin> perfSetPortEEMask 11, “00:00:ff”, “00:00:ff”, “00:00:ff”, “00:00:ff” The EE mask on port 11 is set and EE counters are reset.
Using Advanced Performance Monitoring 3 Example 1. The following command displays all of the end-to-end monitors on port 3 at an interval of once a second. (In this example, there are three monitors on port 3, numbered 0, 1, and 2.) sw1:admin> perfShowEEMonitor 3, 1 perfShowEEMonitor 3, 1: Tx/Rx are # of bytes and crc is # of crc errors 0 -----------crc Tx Rx ============ 0 0 0 0 53m 4.9m 0 53m 4.4m 0 53m 4.8m 0 53m 4.6m 0 53m 5.0m 0 52m 4.6m 1 -----------crc Tx Rx ============ 0 0 0 0 53m 4.9m 0 53m 4.
3 Using Advanced Performance Monitoring Clearing End-to-End Monitor Counters To clear all of the end-to-end monitor counters on a port, use the perfSetPortEEMask command to reset all of the end-to-end monitor counters on that port. Note: The perfSetPortEEMask command also sets the end-to-end mask, so if you do not want to change the mask, you must re-specify the current mask settings. You can view the current mask settings using the perfShowPortEEMask command.
Using Advanced Performance Monitoring 3 sw1:admin> perfAddReadMonitor 2 SCSI Read filter monitor #0 added sw1:admin> perfAddWriteMonitor 2 SCSI Write monitor #1 added sw1:admin> perfAddRWMonitor 2 SCSI Read/Write monitor #2 is added sw1:admin> perfAddSCSIMonitor 2 SCSI traffic frame monitor #3 added sw1:admin> perfAddIPMonitor 2, IP traffic frame monitor #4 added sw1:admin> perfShowFilterMonitor 2 There are 5 filter-based monitors defined on port 2.
3 Using Advanced Performance Monitoring 0 1 2 3 4 5 6 7 SOFf SOFc1 SOFi1 SOFn1 SOFi2 SOFn2 SOFi3 SOFn3 The hardware can manage only a limited number of unique offsets and values. If the switch does not have enough resources to create a given filter, then other filters may have to be deleted to free up resources. Example 1. This command adds a filter-based monitor to count all FCP and IP frames received from domain 0x02 for port 2.
Using Advanced Performance Monitoring 3 sw1:admin> perfShowFilterMonitor 2, 1 0 1 2 3 4 5 6 #CMDs #CMDs #CMDs #Frames #Frames #Frames #CMDs ------------------------------------------------------------0 0 0 0 0 0 0 26k 187 681 682 682 494 187 26k 177 711 710 710 534 176 26k 184 734 734 734 550 184 26k 182 649 649 649 467 182 26k 188 754 755 755 567 184 Example 2. The following command displays the cumulative frame count of all filter-based monitors defined on port 2.
3 Using Advanced Performance Monitoring Clearing Filter-Based Monitor Counters To clear a filter-based monitor counter, delete the monitor using the perfDelFilterMonitor command, and then add the monitor again, using the appropriate command: • • • • • • perfAddReadMonitor perfAddWriteMonitor perfAddRWMonitor perfAddSCSIMonitor perfAddIPMonitor perfAddUserMonitor Saving and Restoring Monitor Configuration You can use the perfCfgSave command to save the current end-to-end and filter monitor configuration
Glossary 8b/10b Encoding An encoding scheme that converts each 8-bit byte into 10 bits. Used to balance ones and zeros in high-speed transports. Address Identifier A 24-bit or 8-bit value used to identify the source or destination of a frame. Advanced Performance Monitoring A software product that provides error and performance information to the administrator and end user for use in storage management.
BER Bit Error Rate; the rate at which bits are expected to be received in error. Expressed as the ratio of error bits to total bits transmitted. See also Error. Block As applies to Fibre Channel, upper-level application data that is transferred in a single sequence. Broadcast The transmission of data from a single source to all devices in the fabric, regardless of zoning. See also Multicast, Unicast.
Disparity The relationship of ones and zeros in an encoded character. “Neutral disparity” means an equal number of each, “positive disparity” means a majority of ones, and “negative disparity” means a majority of zeros. Distributed Fabrics The combined user’s guides for the software products Extended Fabrics and Remote Switch. “Distributed Fabrics” is not a software product. See also Extended Fabrics, Remote Switch. DLS Dynamic Load Sharing; dynamic distribution of traffic over available paths.
Fabric Manager A software product that works in conjunction with Web Tools to provide a graphical user interface for managing switch groups as a single unit, instead of as separate switches. Fabric Manager is installed on and run from a computer workstation. Fabric Name The unique identifier assigned to a fabric and communicated during login and port discovery. Fabric OS Operating system on HP Brocade switches.
FSPF Fabric Shortest Path First. Routing protocol for Fibre Channel switches. Full-duplex A mode of communication that allows the same port to simultaneously transmit and receive frames. See also Half-duplex. Fx_Port A fabric port that can operate as either an F_Port or FL_Port. See also F_Port, FL_Port. G_Port Generic Port; a port that can operate as either an E_Port or F_Port. A port is defined as a G_Port when it is not yet connected or has not yet assumed a specific function in the fabric.
JBOD Just a Bunch Of Disks; indicates a number of disks connected in a single chassis to one or more controllers. See also RAID. K28.5 A special 10-bit character used to indicate the beginning of a transmission word that performs Fibre Channel control and signaling functions. The first seven bits of the character are the comma pattern. See also Comma. L_Port Loop Port; a node port (NL_Port) or fabric port (FL_Port) that has arbitrated loop capabilities.
Multimode A fiber optic cabling specification that allows up to 500 meters between devices. N_Port Node Port; a port on a node that can connect to a Fibre Channel port or to another N_Port in a point-to-point connection. See also NL_Port, Nx_Port. Name Server Frequently used to indicate Simple Name Server. See also SNS. NL_Port Node Loop Port; a node port that has arbitrated loop capabilities. Used to connect an equipment port to the fabric in a loop configuration through an FL_Port.
Private Device A device that supports arbitrated loop protocol and can interpret 8-bit addresses, but cannot log into the fabric. Private Loop An arbitrated loop that does not include a participating FL_Port. Protocol A defined method and a set of standards for communication. Public NL_Port An NL_Port that logs into the fabric, can function within either a public or a private loop, and can communicate with either private or public NL_Ports.
SI Sequence Initiative. Single Mode The fiber optic cabling standard that corresponds to distances of up to 10 km between devices. SNMP Simple Network Management Protocol. An internet management protocol that uses either IP for network-level functions and UDP for transport-level functions, or TCP/IP for both. Can be made available over other protocols, such as UDP/IP, because it does not rely on the underlying communication protocols. See also Community (SNMP).
U_Port Universal Port; a switch port that can operate as a G_Port, E_Port, F_Port, or FL_Port. A port is defined as a U_Port when it is not connected or has not yet assumed a specific function in the fabric. UDP User Datagram Protocol; a protocol that runs on top of IP and provides port multiplexing for upper-level protocols. ULP Upper-level Protocol; the protocol that runs on top of Fibre Channel. Typical upper-level protocols are SCSI, IP, HIPPI, and IPI.
Index A adding end-to-end monitors 3-3 filter-based monitors 3-8 AL_PA monitoring 1-2, 3-2 C clearing CRC error count 3-2 end-to-end monitor counters 3-8 filter-based monitor counters 3-12 CRC errors, displaying 3-2 D definitions 1-2 deleting end-to-end monitors 3-7 filter-based monitors 3-11 displaying CRC error count 3-2 end-to-end mask 3-6 end-to-end monitors 3-6 filter-based monitors 3-10 end-to-end monitors adding 3-3 clearing counters 3-8 deleting 3-7 displaying 3-6 displaying the mask 3-6 restori
M T mask for end-to-end monitors displaying 3-6 setting 3-4 technical support vii telnet commands supportShow command terminology 1-2 vii P 3-3 perfAddIPMonitor command 3-8 perfAddReadMonitor command 3-8 perfAddRWMonitor command 3-8 perfAddSCSIMonitor command 3-8 perfAddUserMonitor command 3-9 perfAddWriteMonitor command 3-8 perfCfgRestore command 3-12 perfCfgSave command 3-12 perfClrAlpaCrc command 3-2 perfDelEEMonitor command 3-7 perfDelFilterMonitor command 3-11 performance graphs 1-3 perfSetPortEEM