
Software Manual
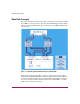
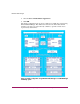

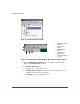
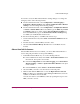
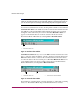
Table Of Contents
- Contents
- About this Guide
- NAS Data Path Manager
- Product Overview
- Data Path Concepts
- Install NAS Data Path Manager
- Monitor Data Paths
- Use Performance Monitor to Monitor HBAs
- View Volume Groups for Path Information
- Decide Whether to Manage the Data Paths
- Manage the Data Paths
- Text API Commands for NAS Data Path Manager
- Glossary
- Index

NAS Data Path Manager
19hp StorageWorks NAS Data Path Manager Installation and User’s Guide
You can also access the Performance Monitor Settings dialog box to change the
settings by either of the following methods.
■ From Command View NAS, select Configuration > Alerts/Logging >
Performance Monitor Settings, then Actions > Edit Performance Monitor
Settings to view and change the monitoring settings.
■ From Command View NAS, select Configuration > Configuration Wizard
> Actions > Launch Wizard. Then select Next to get the What do you want
to configure? dialog box. Select only the Alert and Monitor Settings box,
then select Next until you get to the Performance Monitor Settings dialog
box. Make your enable/disable selections here.
To clear the monitoring history of an HBA, follow these steps.
1. From Command View NAS, select Tools > Performance Monitor from the
menu bar.
2. From the item tree, select the HBA you wish to clear.
3. Select the Clear Monitor History on Server icon on the Metric Actions
Toolbar.
Observe Data Path Performance
Once the HBA metrics have been enabled, you can use Performance Monitor to
observe data path performance for the specified HBA(s).
1. Launch Performance Monitor by one of the following methods.
■ From Command View NAS, select Tools > Performance Monitor from
the menu bar. This opens a new window.
■ From the Configuration tab under Alerts/Logging, select Performance
Monitor Settings > Actions > Open Performance Monitor. This opens
a new window.
■ From the Status tab, select Actions > Performance Monitor.
2. Select the HBA you wish to view from the tree in the left panel.
3. Either double-click the HBA name or select the Open Chart for Selected
Item icon. This icon is available by right-clicking the HBA name, and is also
available on the Metric Actions Toolbar.
You can view data for several HBAs at a time by repeating this step for each
HBA you wish to observe.