
Software Manual
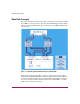
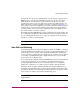
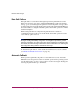
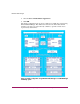

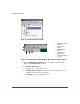
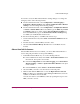
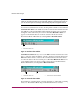
Table Of Contents
- Contents
- About this Guide
- NAS Data Path Manager
- Product Overview
- Data Path Concepts
- Install NAS Data Path Manager
- Monitor Data Paths
- Use Performance Monitor to Monitor HBAs
- View Volume Groups for Path Information
- Decide Whether to Manage the Data Paths
- Manage the Data Paths
- Text API Commands for NAS Data Path Manager
- Glossary
- Index

NAS Data Path Manager
20 hp StorageWorks NAS Data Path Manager Installation and User’s Guide
Note: Since Performance Monitor runs in a separate window, you can keep it open
while you are making changes to your data path settings in Command View NAS, so
you can view the impact of a change without exiting the path management session.
You can view each chart in two modes; showing either real-time or historical data.
View Real-time chart is the default view. This view shows the read rate and write
rate (MB/sec) of the specified HBA. Measurements are taken every 5 seconds,
and appear on the chart as they are received. The View Real-time chart icon
appears on the Chart Toolbar. You can also switch to this mode from the
Performance Monitor Menu Bar by selecting View > Real-time Chart.
Figure 5: Real-time Chart Toolbar
View Historical chart allows you to see the HBA read rate and write rate for the
last 1 to 24 hours. Select the number of hours to display by using the slider in the
HBA Performance chart tool bar. Use the scroll bar at the bottom of the chart to
see all of the data for the selected time period. The View Historical chart icon is
on the Chart Toolbar. You can also switch to this mode from the Performance
Monitor Menu Bar by selecting View > Historical Chart.
Figure 6: Historical Chart Toolbar
For instructions on printing charts, exporting chart data, or getting help on reading
charts, see “Performance Monitoring” in the HP NAS 8000 User’s Guide.
1. Real-time Chart icon
1. Historical Chart icon 2. Time interval selection Slider
1
1
2