HP StoreFront Analytics Pack for VMware vCOPS™ 1.1 User Guide Abstract This guide provides the information you need to install and use HP StoreFront Analytics Pack for VMware vCOPS™ 1.1 to monitor performance for HP 3PAR Storage Systems, and is intended for system and storage administrators who monitor and direct system configurations and resource allocation for HP 3PAR Storage Systems.
© Copyright 2014 Hewlett-Packard Development Company, L.P. Confidential computer software. Valid license from HP required for possession, use or copying. Consistent with FAR 12.211 and 12.212, Commercial Computer Software, Computer Software Documentation, and Technical Data for Commercial Items are licensed to the U.S. Government under vendor's standard commercial license. The information contained herein is subject to change without notice.
Contents 1 Introduction...............................................................................................5 2 Installation.................................................................................................6 Installing the software................................................................................................................6 Windows Installation Procedure.............................................................................................
5 Support and Other Resources.....................................................................39 Contacting HP........................................................................................................................39 HP 3PAR documentation..........................................................................................................39 Typographic conventions.........................................................................................................
1 Introduction HP StoreFront Analytics Pack for VMware vCOPS™ 1.1 provides integrated and highly automated performance, capacity, configuration compliance, and cost management tools to the vCenter Operations Manager custom Graphical User Interface (GUI). The software uses the VCOPs analytics engine that analyzes what is normal and then applies them to a dynamic HP 3PAR environment.
2 Installation The HP StoreFront Analytics Pack for VMware vCOPS™ 1.1 is installed into the vCenter Operations Manager custom GUI by using the Update tab of the vCenter Operations Manager Administration interface and a PAK file. Installing the software The HP StoreFront Analytics Pack for VMware vCOPS™ 1.1 software can be installed on a Windows, Linux, or vApp platforms. This section describes the installation process for each platform.
The Custom user interface will find the adapter files and gather the information about the abilities of the adapter. It will then update the user interface with information about the adapter. The Describe process will take several minutes and when it completes, the adapter will appear in the Adapters Info pane (the build number will appear in the Adapter Version column).
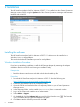
3. 4. On the Update tab, click Browse to locate the temporary folder and select the PAK file. Click Update and then click OK to confirm the update. The vCenter Operations Manager Administration GUI uploads the PAK file. 5. 6. Read and accept the EULA, and then click OK. Click OK to start the update process. The update might take several minutes. Status information appears on the Update tab when the update is finished.
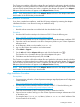
5. Click Test to make sure the parameters are correct. To verify that the CIM service is running on the 3PAR storage system, Open an SSH session to the 3PAR storage system and run the showcim command. The output should indicate the state of the service as Active (see Figure 1 (page 9) . Figure 1 SHOWCIM command output If the State is inactive, you can activate it by running startcim command. After about 5 minutes, run the showcim command to check the status of the CIM service.
2. 3. 4. Click the Admin > Support. Click the Info tab. Under Adapters Info, view the HP Storage Adapter version in the Adapter Version column. Troubleshooting the software installation Known troubleshooting information can help you diagnose and correct problems with the HP Storage Adapter. Log files contain valuable information about adapter instance operation.
Notes Resource Kinds The HP 3PAR resources for the HP Storage Adapter are prefixed with HP 3PAR. For example HP Storage Adapter Instance, HP 3PAR Array, HP 3PAR Array Controller, HP 3PAR Disk Drive. Adapter Kind The adapter kind for the HP Storage Adapter is HP Storage Adapter. Use 1. 2. 3. the following procedure to view the adapter kind. In vCenter Operations Manager, click ENVIRONMENT > ENVIRONMENT OVERVIEW. Expand the Adapter Kinds list. Click HP Storage Adapter in the list.
Adapter Instances The adapter instances for the HP Storage Adapter are in the HP Storage Adapter Instance under Adapter Instances. Use 1. 2. 3. the following procedure to view the adapter instances. In vCenter Operations Manager, click ENVIRONMENT > ENVIRONMENT OVERVIEW. Expand the Adapter Instances in the list. Expand the HP Storage Adapter Instance. The HP Storage Adapter Instance appears in the List tab in the Data Source column and is indicated by the icon.
Resource metrics reported for HP 3PAR resources The metrics that are reported by HP 3PAR resources are shown in Table 1 (page 13).
Table 1 HP 3PAR resources reported metrics (continued) Resource Reported Metrics HP 3PAR Drive Cage Health • State HP 3PAR Fan Health • State HP 3PAR FC Port FC Port Performance • IO Size in KB • IOPS (Read) • IOPS (Write) • IOPS (Total) • KBPS (Read) • KBPS (Write) • KBPS (Total) • Queue Depth • Response Time in ms Health • State HP 3PAR iSCSI Port FC Port Performance • IO Size in KB • IOPS (Read) • IOPS (Write) • IOPS (Total) • KBPS (Read) • KBPS (Write) • KBPS (Total) • Queue Depth • Response Ti
Table 1 HP 3PAR resources reported metrics (continued) Resource Reported Metrics • KBPS (Read) • KBPS (Write) • KBPS (Total) • Queue Depth • Response Time in ms Notes 15
3 Dashboards The customized HP dashboards are available as tabs or from the DASHBOARDS menu in the vCenter Operations Manager custom GUI. The dashboards consists of customized widgets with customized interactions and several standard widgets. You can modify the dashboards with additional standard widgets. To modify the dashboard, see “Editing a dashboard” (page 16). To open the custom GUI, in a browser window, log in to the vCenter Operations Manager custom GUI as the admin user (for example: https://xx.xx.
• HEAT MAP (SELECT CONFIGURATION FROM DROPDOWN) • HEALTH (SELECT STORAGE SYSTEM ABOVE) • HP STORAGE SYSTEM ALERTS • Metrics (SELECT STORAGE SYSTEM ABOVE) • 50 LEAST HEALTHY HP 3PAR RESOURCES To initialize the interactions of the dashboard, you first need to select a storage system in the HP STORAGE SYSTEMS widget.
HP Storage Monitoring dashboard Interactions The following interactions occur with the HP Storage Monitoring dashboard when you select a storage system in the HP STORAGE SYSTEM widget: • The HP STORAGE SYSTEM ALERTS widget updates to show alerts for the storage systems that are configured in the environment. The HEAT MAP widget updates to show information about the selected configuration.
STORAGE SYSTEMS widget This widget shows the storage systems configured in the environment. Selecting a storage system in this widget displays a heat map of the storage system in the HEAT MAP widget as well as a view of all of the resources within the storage system in the HEALTH widget. The list can be sorted by column heading. • Name - the name of the storage systems configured by the user. • Health - the health of the storage systems as reported by the vCOPs analytics.
HEALTH widget This widget shows a graphical representation of the health of the selected storage system. An icon is shown for each resource of the storage system and a colored box indicates the health status for each resource (see “Dashboard color coding” (page 16)). Double clicking an icon will bring that resource into focus and display a detailed health graphic in the HEALTH STATUS widget below. Storage Systems widget icons The resources in the storage system are represented by icons in the dashboard.
- Disk Drive. - Disk Array Fan. - Array Controller Port (FC or iSCSI). - Common Provisioning Group (CPG) or Storage Pool. - Virtual Volume.
HEALTH STATUS widget This widget shows a detailed representation of the health of the selected resource over time. The resources are selected by clicking an icon in the HEALTH widget. The timeline and other parameters can be changed using the Edit Widget button (see “Editing a dashboard widget” (page 16)). HEAT MAP widget This widget shows a heat map of the selected Configuration.
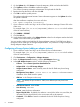
The following graphics show sample heat maps for different resource kinds.
IOPS - HP 3PAR DISK DRIVE 24 Dashboards
HP STORAGE SYSTEM ALERTS widget This widget lists if there are any alerts for the storage system and provides a convenient way to view and manage alerts. When you double-click an alert in the ALERTS widget, the Alert Summary page appears with details about the alert. METRICS widget This widget shows a graph containing metrics for the selected resource kind in the HEAT MAP widget.
50 LEAST HEALTHY HP 3PAR RESOURCES widget This widget lists the 50 least healthy resource kinds in the environment. The number and types of items displayed can be modified by editing the widget. The utilization information can be used to rebalance the loads to volumes with lower utilization.
HP Storage Troubleshooting dashboard The HP Storage Troubleshooting dashboard is used to troubleshoot the storage system components. The dashboard also provides summary information about VMs and how they map to HP storage volumes, pools, disks and ports. The dashboard includes graphs for key performance metrics such as IOPS and bandwidth, which are displayed in relation to the selected object of the VM to Storage Mapping widget.
HP Storage Troubleshooting dashboard Interactions The following interactions occur with the HP Storage Troubleshooting dashboard when you select a virtual machine in the VIRTUAL MACHINES widget: • The ALERTS widget updates to show alerts for the resources. • The VM TO STORAGE MAPPING widget will be updated with status information on the selected virtual machine in the VIRTUAL MACHINES widget.
- selects the badges in the storage system that represent health values for the resources in the storage system. The health badges indicate the current storage system performance. - selects the badges in the storage system that represent workload values for the resources in the storage system. These represent the demand for resources within the storage system. - selects the badges in the storage system that represent capacity values for the resources in the storage system.
The Health, Workload, and Capacity icons appear colored next to each component to indicate the values (see “Dashboard color coding” (page 16)). The values can be filtered by state by clicking the Status Filter icons in the widget header. Components can also be sorted alphabetically or numerically using the Sort By drop down list. MAPPING DETAILS widget This widget shows a health tree for the selected resource in the VM TO STORAGE MAPPING widget.
METRIC GRAPH (SELECT RESOURCE FROM VM TO STORAGE MAPPING) widget The metrics displayed in the screen are determined by the resource selected in the VM TO STORAGE MAPPING widget (Virtual Machine, Datastore, HP 3PAR Volume, etc.). For details on the displayed metrics, see “Resource metrics reported for HP 3PAR resources” (page 13).
ALERTS widget This widget shows a lists of all alerts for all monitored resources in the storage system. The list can be sorted by column heading.
HP Storage Performance dashboard The HP Storage Performance dashboard is used to monitor the resources with the highest utilization within the storage system. If the storage system is experiencing performance issues, this dashboard is a good place to start looking for resources with issues. There is no customized interaction between the widgets on this dashboard; however, the widgets are customized to show specific resources within the storage system that are approaching critical performance values.
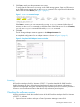
Figure 7 HP Storage Performance dashboard NOTE: The interactions on the HP Storage Performance dashboard have not been customized. CAPACITY UTILIZATION (%) - TOP-5 VOLUMES widget This widget shows the five volumes with high utilization. The Volume Capacity - Capacity Utilization in percent metric is used to determine the Utilization Index which can be used to rebalance the workload to resources with a lower index.
RESPONSE TIME (MS) - TOP-5 VOLUMES widget This widget shows the five volumes with high response times. The Volume Performance - Response Time in ms metric is used to determine the Utilization Index which can be used to rebalance the workload to resources with a lower index. QDEPTH - TOP-5 VOLUMES widget This widget shows the five volumes with high pending input/output operations.
RESPONSE TIME (MS) - TOP-5 FC PORTS widget This widget shows the five fibre channel ports with high response times. The FC Performance Response Time in ms metric is used to determine the Utilization Index which can be used to rebalance the workload to resources with a lower index. IOPS - TOP-5 iSCSI PORTS widget This widget shows the five ISCSI ports by IOPS with high usage.
RESPONSE TIME (MS) - TOP-5 PHYSICAL DISKS widget This widget shows the five disk drives with high response times. The Physical Disk Performance Response Time in ms metric is used to determine the Utilization Index which can be used to rebalance the workload to resources with a lower index. IOPS - TOP-5 PHYSICAL DISKS widget This widget shows the five disk drives with high input/output operations per second.
4 Using the HP StoreFront Analytics Pack for VMware vCOPS™ 1.1 Analyzing performance issues To gain deeper visibility of the critical storage resources from within vCenter Operations Manager, specific storage platform adapters are required. The HP StoreFront Analytics Pack for VMware vCOPS™ 1.1 is a software adapter that extends vCenter Operations Manager functionality to support HP 3PAR StoreServ arrays. VMware administrators using HP StoreFront Analytics Pack for VMware vCOPS™ 1.
5 Support and Other Resources Contacting HP For worldwide technical support information, see the HP support website: http://www.hp.
For information about: See: Migrating data from one HP 3PAR storage system to another HP 3PAR-to-3PAR Storage Peer Motion Guide 40 Configuring the Secure Service Custodian server in order to monitor and control HP 3PAR storage systems HP 3PAR Secure Service Custodian Configuration Utility Reference Using the CLI to configure and manage HP 3PAR Remote Copy HP 3PAR Remote Copy Software User’s Guide Updating HP 3PAR operating systems HP 3PAR Upgrade Pre-Planning Guide Identifying storage system compo
For information about: See: Planning for HP 3PAR storage system setup Hardware specifications, installation considerations, power requirements, networking options, and cabling information for HP 3PAR storage systems HP 3PAR 7200, 7400, and 7450 storage systems HP 3PAR StoreServ 7000 Storage Site Planning Manual HP 3PAR StoreServ 7450 Storage Site Planning Manual HP 3PAR 10000 storage systems HP 3PAR StoreServ 10000 Storage Physical Planning Manual HP 3PAR StoreServ 10000 Storage Third-Party Rack Physic
Typographic conventions Table 2 Document conventions Convention Element Bold text • Keys that you press • Text you typed into a GUI element, such as a text box • GUI elements that you click or select, such as menu items, buttons, and so on Monospace text • File and directory names • System output • Code • Commands, their arguments, and argument values • Code variables • Command variables Bold monospace text • Commands you enter into a command line interface • System
Glossary CPG Common Provisioning Group - defines the Logical Disk creation characteristics, such as RAID type, set size, disk type for chunklet selection, plus total space warning and limit points. A CPG creates a virtual pool of LDs that allows Volumes to share resources and to allocate space on demand. A volume created from a CPG can automatically be grown on demand by mapping new regions from the LDs associated with the CPG.
Index A I Adapter Instance, 12 Adapter Kind, 11 Installation Linux, 7 vApp, 7 Windows, 6 interactions HP Storage Monitoring, 18 HP Storage Troubleshooting dashboard, 28 C conventions text symbols, 42 D Dashboard cloning, 16, 18 color codes, 16 customized, 16 editing, 16 HEAT MAP widget, 22 HP Storage Monitoring, 16 HP Storage Performance, 33 HP Storage Troubleshooting, 27 STORAGE SYSTEMS widget, 19 Dashboard widgets 50 LEAST HEALTHY HP 3PAR RESOURCES, 26 ALERTS, 32 CAPACITY UTILIZATION (%) - TOP-5 VOLU