HP StreamSmart 400 User Guide 1
StreamSmart 400 Acknowledgments Manual written by G.T. Springer Revision History Date Version Revision 1.0 A August 2008 Legal Notices This manual and any examples contained herein are provided “as is” and are subject to change without notice. Hewlett-Packard Company makes no warranty of any kind with regard to this manual, including, but not limited to, the implied warranties of merchantability, non-infringement and fitness for a particular purpose.
HP Part Number F2235 - 90001 3
Table of Contents 1 HP Mobile Calculating Laboratory Types of experiments........................................................................ 3 Streaming experiments ..................................................................... 4 The StreamSmart Aplet ..................................................................... 4 The Statistics Aplet ........................................................................... 7 Manual conventions ..........................................................
Oscilloscope mode ........................................................................ 40 StreamSmart 400 and the virtual HP 39/40gs .................................. 41 Keyboard shortcuts ........................................................................ 42 Mathematical details: zoom, pan, and trace ..................................... 42 5 Warranty, Regulatory, and Contact Information Replacing the battery .....................................................................
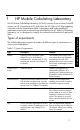
1 HP Mobile Calculating Laboratory Types of experiments The Mobile Laboratory supports a number of different types of experiments, as shown in the table below. Table 1-1 Types of experiments Type Description Example Stream Displays a live time graph (data stream) for up to four sensors simultaneously, at rates up to 5,700 samples per second. See Chapter 2 for details.
Streaming experiments The HP MCL defaults to a stream experiment when started. In a streaming experiment, data is displayed graphically on the HP 39/40gs calculator as it streams in from the StreamSmart 400 at frequencies of up to 5,700 samples per second (5.7 KHz).
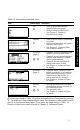
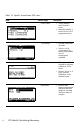
Table 1-2 StreamSmart standard views Name/Key(s) Description Plot R Numeric S Plot setup (page 1) @R Plot setup (page 2) Numeric setup @S • View up to four data streams graphically as time graphs • Perform streaming experiments • See Chapter 2, Streaming Experiments for details • View up to four sensors numerically in a meter • Perform selected events and eventswith-entry experiments • See Chapter 3, Capturing Data from Events for details • Optional: set up the window for the graphic view of the dat
Table 1-3 Specific StreamSmart 400 views View Name/Key(s) Sensor setup Description • Select/deselect each channel’s sensor • Manually identify a sensor from a list of supported sensors Unit setup • Activate/deactivate channels • Select a unit of measurement for sensors with multiple units of measurement available Calibrate • Select a sensor’s channel for software calibration of the sensor • Perform 1-point or 2point software calibration of the selected sensor Experiment 6 HP Mobile Calculating Labo
The Statistics Aplet (timestamp, channel 1 sensor, channel 2 sensor, channel 3 sensor, channel 4 sensor) Of course, one or more of the four channels may not have a sensor attached. In that case, the ordered data-tuple is shortened appropriately. Once you select the data you want to analyze, the data is sent to columns in the Statistics Aplet. The Statistics Aplet has ten columns available for data, C1 through C9, and C0.
3. 4. 5. The StreamSmart Aplet also employs dialogue boxes from time to time, as shown in the Streamer Plot Setup view in Table 1-2 above. The field names in menus and other data are shown in bold type. For example, in the top left corner of the Plot Setup dialog box in Table 1-2, there is a field named XRNG. In this manual, the field name is shown in bold as XRNG. Screen captures are provided to assist you in checking your data. The actual data will vary.
2 Streaming Experiments Most often, you will simply plug up to four Fourier® sensors into the front of the StreamSmart 400, connect the StreamSmart 400 to the HP 39/40gs serial port, and turn the switch on the right side to the ON position.
Table 2-1 Streaming experiment flow Display Description How I got there: • Press U Datastreamer % What I see on screen: • Up to four data streams displayed graphically in realtime • Channel number, sensor type and units for the current selected stream, and screen width expressed in seconds Figure 2-2 Stream What I can do: • CHAN: select a channel (stream) to trace, etc.
Table 2-1 Streaming experiment flow Display Description How I got there: • Press What I see on screen: • Same as page 1, but with different menu keys What I can do: • EDIT: choose a set number of samples between two chosen time values • SUBTRACT or ADD data-tuples to the current data set • CANCL to return to the current data stream or OK to export the current data set to the Statistics Aplet • (previous page) to return to page 1 Display Description How I got there: • Press &!OK& What I see on screen:
Table 2-1 Streaming experiment flow Display Description How I got there: • Press &!OK& and then press any key What I see on screen: • Numeric view of the Statistics Aplet, with data in columns Figure 2-6 Analyze the data What I can do: • TABLE: scroll through the table of data using • GRAPH: graph data using W, X, Z, and Y V Auto Scale • 1VAR/2VAR: toggle between analysis of 1-variable and 2-variable data • STATS: view summary statistics • MORE: see the HP 39/40gs User Guide for more information on t
The screens shown in Figure 2-7 and Figure 2-8 illustrate the location and basic functions of the menu keys during and just after streaming. Use @ZOOM! and @@PAN# to modify the appearance of the streams. \SCOPE starts streaming in oscilloscope mode, in which the data streams from left to right across the screen, then repeats upon reaching the right edge of the display, similar to the sweep of an oscilloscope. \START /kSTOP is a toggle that stops and restarts data streaming.
Table 2-2 lists the menu functions available during and just after streaming. Table 2-2 Menu keys during data streaming, page 1 Menu Key Description \CHAN This menu key opens the channel selection menu, which allows you to select which stream to trace. By extension, you are also choosing which stream to zoom or pan vertically. Alternately, you can use the keys numbered 1-4 to select a channel. @@PAN# /\ZOOM This menu key is a toggle that determines how the direction keys function.
Table 2-3 Functions controlled by the direction keys Menu Key Description • Use these keys to zoom in or out horizontally @ZOOM! ZY • If you are actively streaming data, these keys speed up the stream or slow it down • If streaming has stopped, trace to data of interest and then switch to Zoom to zoom in or out on the tracer coordinates. The tracer location stays fixed.
Besides navigating and tracing the data set to find data of interest, StreamSmart also lets you compare any two points in a single stream and manually add a datatuple as a row in your chosen columns in the Statistics Aplet. These functions are found on the second page of the Stream menu, which is only active once streaming has stopped. Mark and Swap can be used together to examine the relationship between points in the data stream currently being traced.
Menu Key Description @MRK$ Toggles Mark mode on and off, setting a mark at the current tracer position, or erasing the mark. @SWAP! Switches the tracing cursor and the mark on the current, selected stream. @GOTO@ Permits you to jump to a specific time along the current stream. \SETUP Sets the destination columns for data when %ADD$ is pressed. %ADD$ Adds the current data-tuple to the default columns in the Statistics Aplet. Returns to the previous page of menu keys.
Figure 2-11 Table 2-5 and Table 2-6 describe the new functions available on the two pages of the Export Menu. Table 2-5 Menu keys during export, page 1 Menu Key Description %${nn%$ Toggles left-cropping on and off. Use Y and Z to move the left-crop bar. Data to the left of the bar is excluded from the final data set. $%nn{%$ Toggles right-cropping on and off. Use Y and Z to move the right-crop bar. Data to the right of the bar is excluded from the final data set. Moves to a second page of menu keys.
Export a data set Once you have selected a final data set for analysis, it is relatively simple to export your data to columns in the Statistics Aplet. Figure 2-12 illustrates the fields of the Export menu. There are six fields in the Export menu: four for the StreamSmart 400 channels, one for the timestamp associated with each data-tuple, and one that determines what happens after the data is exported.
Table 2-7 Export menu dialog box options Field Menu Key Description CH1 !sgsy]!!CHK Toggles between selecting and deselecting the current channel. The data from any active channel (its stream) will be exported; the data from any inactive channel will not be exported. CHOOS Opens a dropdown box with the names of the columns in the Statistics Aplet (C1, C2, C3...C9, and C0). Choose any column as the destination for the data from this channel.
The Numeric view shows your columns of data arranged in a table. Although only four columns are displayed, there are actually ten columns available. Use Y and Z to move from column to column; use X and W to navigate through the data in a column. The easiest way to see a graph of your data is to press V and select the Autoscale option. If your graph is a scatter plot, press @MENU! and then $@FIT#@ to see the fit model plotted with your data.
Table 2-9 Views in the Statistics Aplet using the SHIFT key Symbolic Setup @ Q Figure 2-17 Choose fits 22 Streaming Experiments Plot Setup @ R Figure 2-18 Setup the graph
Capturing Data from Events Although the StreamSmart 400 is capable of collecting data at high sampling rates, as shown in Chapter 2, it is also versatile enough to gather data from experiments of slower frequency—and even distinct events—with ease. You have seen the power of streaming data in real time at speeds over 5,000 samples per second with the streaming experiment.
Table 3-1 illustrates what you see on screen and summarizes what you can do at each step in experiments in which you wish to capture data from distinct events.
Table 3-1 Capturing data from discrete events View Description How I got there: • Press @STAT! What I see on screen: • Numeric view of data in the Statistics Aplet What I can do: • TABLE: scroll through the table of data using • GRAPH: graph data using W, X, Z, and Y V Auto Scale • 1VAR/2VAR: toggle between analysis of 1-variable and 2-variable data • STATS: view summary statistics • MORE: see the HP 39/40gs User’s Guide for more information on the Statistics Aplet, including regression fit types and
Table 3-2 lists the menu keys and their functions for Figure 3-5 Table 3-2 Menu keys in the Numeric view Menu Key Description %ADD$ • Adds the current reading(s) to the data set as a single event @SETUP • Choose Selected Events, Events with Entry, or Auto Number • See the section below titled, Monitor and select events • Activate/deactivate each of the four channels • Choose destination columns for data from each active channel • See the section below titled, Set up experiment !PROBE • Manually iden
Like the Export menu discussed in Chapter 2, the Capture Events menu has a field for each of the four StreamSmart 400 channels. Each of these fields is preceded by a checkbox to activate/deactivate the channel, and followed by a choose box to select the Statistics Aplet column for storing the data from that channel. There is also an EVENT METHOD field that controls what happens each time you press %ADD$.
Figure 3-7 An events-with-entry set up In Figure 3-7, C2 is highlighted as the destination for data from the sensor in Channel 2 of the StreamSmart 400. Pressing !sgsy]!!CHK! now will toggle Channel 2 to be inactive. Pressing the CHOOS menu key drops down a list of C1 through C9, and C0, from which you can choose any other column for the data from the sensor in Channel 2.
Figure 3-10 Event Only Figure 3-11 With Entry Once you have captured all your events, press the @!STAT@ menu key to proceed to the Statistics Aplet, where your data set has been saved. For a brief summary of the Statistics Aplet, refer to the section titled, Analyze experimental data in Chapter 2. For more complete information, please consult the HP 39/40gs User’s Guide. Data logging Under certain circumstances, it is desirable to run an experiment for a particular duration (e.g.
seconds (x:3.0s). At this point, the student is ready to select and export a final data set. Refer to the section titled, Select a set of data in Chapter 2 for more details on selecting and exporting a data set.
4 Advanced Topics This chapter is devoted to a number of advanced topics, including: • • • • • • • • Sensor setup Unit setup Calibration The Plot Setup menu Oscilloscope mode StreamSmart on the virtual HP 39/40gs calculator Keyboard shortcuts Mathematical detail behind the zoom and pan features Sensor setup: manually identify a sensor The StreamSmart Aplet is designed to automatically identify a Fourier® sensor attached to the StreamSmart 400.
Figure 4-3 Figure 4-4 Figure 4-5 Unit setup: manually select units for a sensor When the StreamSmart Aplet automatically identifies a sensor, it also chooses a unit of measurement for that sensor. All subsequent readings from that sensor are shown using the current unit of measurement. Many, but not all, of the probes have multiple units of measurement available. For sensors that do have multiple units available, you can change the unit of measurement at any time using the Unit Setup dialog box.
Press $OK# to return to the dialog box with the changes shown (Figure 4-8). Press $OK# to exit the dialog box and activate the changes. Figure 4-9 shows the Numeric view with the new units. Figure 4-8 Figure 4-9 Many Fourier® sensors are factory-calibrated and should not need user calibration. However, most of those that do require user calibration have an adjustment screw on the sensor itself for hardware calibration.
Figure 4-10 3. h Figure 4-12 shows the calibration screen, with its options for 1- or 2-point calibration. Note that the meter continues to show the live streaming of sensor values. Press %1$ to enter the correction for the current reading. The current reading is still 6.408, but it should read -6.433. Enter the correct value as shown in Figure 4-13 and press $OK# to return to the calibration screen. Figure 4-12 4. 5.
The Plot Setup menu The Plot Setup menu gives you access to a number of advanced options for streaming experiments. Among these are overriding the default streaming window settings and the default data filtering methods. Setting the stream window Advanced Topics In most cases, you will use the zoom and pan features to match the display dimensions to the set of data points you find interesting. In some cases, however, you may want to see all the data between two known time values.
Plot display options When performing experiments with multiple probes, the StreamSmart Aplet places each data stream in its own swim-lane by default. The data streams appear in the numerical order of their channels, from top to bottom of the display. Under certain circumstances, you may want to see multiple data streams superimposed instead of separated in swim-lanes. In the Plot Setup menu, the Plot Display field allows you to choose either option. This field has two settings: Stack and Overlay.
As you zoom out, each pixel represents a larger and larger set of readings. Zooming in makes each pixel represent a smaller and smaller set of readings until, when you have zoomed all the way in, each pixel finally does represent a single reading. This is fundamental to the StreamSmart solution to data collection: the full data set is available to the user and is only filtered for display and export purposes.
3. 4. Use X and W to highlight your selection and press the $OK# key. Press R to return to the graphic view using the new filtering method. Figure 4-27 Figure 4-28 Table 4-1summarizes the display filtering options available in the Display Filter field of the Plot Setup menu. Table 4-1 Display filters Name Description Average Uses the average of the data in each pixel interval to represent the data. Single Value Uses a single value to represent the data.
Table 4-2 Additional export filters Name Description Auto This is the default option. It matches the export filter to the display filter. WYSIWYG This option filters the data so that the scatter plot in the Statistics Aplet matches the graph in the StreamSmart Aplet exactly. The results of this filtering depends on your zoom level. By default, StreamSmart 400 collects data from a single sensor at approximately 5,700 samples per second while streaming.
Oscilloscope mode While streaming data in the Plot view, the StreamSmart Aplet provides you with the option of Oscilloscope mode. Press SCOPE to activate Oscilloscope mode. This menu key is a toggle, so press it again to return to normal data streaming. Oscilloscope mode works with a trigger to enable an oscilloscopic view of your data stream. With no trigger set, Oscilloscope mode displays the incoming data in sweeps. Data streaming occurs from left to right across the screen.
Table 4-3 Oscilloscope menu keys, page 1 Menu Key Description This key displays the second page of the oscilloscope menu. Menu Key Description !ooooooo{,,,,,,,% Sets a two-way trigger that operates whether it is crossed from below or above. Use the direction keys to set the location of the trigger. !ooookm{;[,,,,,,^ Sets an ascending trigger. Use the direction keys to set the x- and y-positions for the trigger. !,,,,zv{w[oooooo^ Sets a descending trigger.
Keyboard shortcuts Table 4-5 lists the keyboard shortcuts for the StreamSmart Aplet. These shortcuts are available either during or just after streaming. Table 4-5 Keyboard shortcuts Key(s) . Description Toggles through the three options available for viewing a final data set after streaming and prior to export. See Figure 4-31, Figure 4-32, and Figure 4-33. Figure 4-31 Figure 4-32 / Zooms in vertically, during or after streaming. * Zooms out vertically, during or after streaming.
Aplet Feature Key Description Zoom W The horizontal center line remains fixed, but the window contracts vertically. Ymax decreases and Ymin increases in such a way that their average remains the same. The graph appears to stretch out. If the graph is not centered vertically, the graph may drift as well as stretch. Zoom X Like Zoom W, the horizontal center line remains fixed, but the view dilates vertically. Ymax increases and Ymin decreases in such a way that their average remains the same.
Table 4-7 Pan Aplet Feature Key Description Pan W Moves the stream itself upwards. The values of Ymax and Ymin are decreased by equal amounts. Pan X Moves the stream itself downwards. The values of Ymax and Ymin are increased by equal amounts. Pan Y Moves the stream itself to the right. The values of Xmin and Xmax are decreased by equal amounts. Pan Z Moves the stream to the left. The values of Xmin and Xmax are increased by equal amounts.
5 Warranty, Regulatory, and Contact Information Replacing the battery 1. 2. 3. 4. With the unit turned off, slide the back cover off. Holding the black tab with one hand, carefully detach the old battery by pulling it gently with the other hand. Warning! pulling too hard without supporting the black tab can damage the battery connectors. Connect a new battery by slipping the battery terminals into the proper connectors on the black tab. Be sure the terminals fit securely.
HP warrants to you that HP software will not fail to execute its programming instructions after the date of purchase, for the period specified above, due to defects in material and workmanship when properly installed and used. If HP receives notice of such defects during the warranty period, HP will replace software media which does not execute its programming instructions due to such defects. HP does not warrant that the operation of HP products will be uninterrupted or error free.
Customer care In addition to the one year hardware warranty your HP calculator also comes with one year of technical support. If you need assistance, HP customer care can be reached by either e-mail or telephone. Before calling please locate the call center nearest you from the list below. Have your proof of purchase and calculator serial number ready when you call. Telephone numbers are subject to change, and local and national telephone rates may apply.
48 Ecuador 800-711-2884 El Salvador 800-6160 España 913753382 France 01 4993 9006 Greece Ελλάδα 210 969 6421 Guatemala 1-800-999-5105 Honduras 800-711-2884 Hong Kong 香港特別行政區 852 2833-1111 India www.hp.com/support/india Indonesia +65 6100 6682 Ireland 01 605 0356 Italia 02 754 19 782 Japan 日本 81-3-6666-9925 Korea 한국 www.hp.com/support/korea Magyarország www.hp.com/support Malaysia +65 6100 6682 México 01-800-474-68368 Middle East International www.hp.
0-800-10111 Philippines +65 6100 6682 Polska www.hp.com/support Portugal 021 318 0093 Puerto Rico 1-877 232 0589 Russia Россия 495 228 3050 Schweiz (Deutsch) 01 439 5358 Singapore 6100 6682 South Africa 0800980410 South Korea 한국 2-561-2700 Suisse (français) 022 827 8780 Suomi 09 8171 0281 Sverige 08 5199 2065 Svizzera (italiano) 022 567 5308 Türkiye www.hp.
Product regulatory & environment information Federal Communications Commission Notice This equipment has been tested and found to comply with the limits for a Class B digital device, pursuant to Part 15 of the FCC Rules. These limits are designed to provide reasonable protection against harmful interference in a residential installation.
For questions regarding this FCC declaration, write to Hewlett-Packard Company P.O. Box 692000, Mail Stop 510101 Houston, TX 77269-2000 or call HP at 281-514-3333 To identify your product, refer to the part, series, or model number located on the product. This Class B digital apparatus meets all requirements of the Canadian InterferenceCausing Equipment Regulations. Avis Canadien Cet appareil numérique de la classe B respecte toutes les exigences du Règlement sur le matériel brouilleur du Canada.
Japanese Notice Korean Notice 52 Warranty, Regulatory, and Contact Information
Perchlorate Material - special handling may apply This calculator's Memory Backup battery may contain perchlorate and may require special handling when recycled or disposed in California. Disposal of Waste Equipment by Users in Private Household in the This symbol on the product or on its packaging indicates that this product just not be disposed of with your other household waste.
54 Warranty, Regulatory, and Contact Information
A Aplet statistics 7 StreamSmart 3 B Battery low battery symbol 17 replacing 45 D Data analyzing 20 capturing from events 23 data-tuple 7 exporting 19 history types 39 logging 29 selecting a set 17 DataStreamer flow 10 Direction keys chan 14 functions 15 pan 14 scope 14 trace 14 zoom 14 Display filters 38 choosing a 37 E Experiments streaming 4 types of 3 Export add 18 crop 18 edit 18 keys during 18 subtract 18 Export filters additional 39 choosing a 38 F Filtering data 36 display 36 export 36 H Helpful hi
swap 17 Stream window Meter mode 25 seeing exact time interval 35 N Streaming experiments Numeric view description 9 the meter mode 25 StreamSmart O Aplet 4 Oscilloscope specific views 6 menu keys 40 with virtual calculators 41 trigger 40 StreamSmart 400 Oscilloscope mode 40 connecting 9 S StreamSmart Aplet 4 Sensor specific views 6 calibration 33 standard views 5 calibration of offset, slope 33 V manually choose sensors 31 Virtual Graphing Calculator 41 manually select sensor units 32 setup 31 Statistics v