
Owner manual


36 HP VMA SAN Gateway User’s Guide AM456-9026A
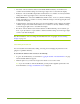
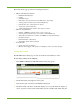
The Cluster Status page provides the following information:
• Master SAN Gateway Statistics
— DRAM and flash allocation
—Port ID
— Total flash memory
— Performance data: read and write rates, DMA active, and pending
— Activity graph (reads and writes) for this SAN Gateway
— Network data: rates of client and server activity
— System drive read and write rates
— Additional SAN Gateway statistics: same data as for master
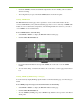
• Memory Array Statistics
— Number of VIMMs in each state (active, spare, booting, etc.)
— Activity graph (reads and writes) color-coded for each SAN Gateway
— Temperatures of ambient air, controller, and VIMMs (for each SAN Gateway)
— Fan status indicators
— Estimated lifetime of flash drives
— Status lights: Alarm, Status, and Ready
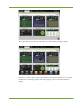
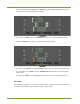
• Network Stats
— Client- and server-side statistics.
— Measure the throughput of all operations including hits, misses, and write-throughs.
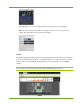
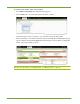
Viewing Cluster Status
The HP VMA Cluster Status page is easily accessible from the Function toolbar.
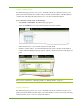
To view cluster statistics, do the following:
1. Select Home > Cluster. The HP VMA Cluster Status page appears.
2. Check alarm status at the right side of the panel.
3. Verify the life span of the flash in the Flash Lifetime panel.
4. Check the health of the Fans. A failed fan displays as red. A problematic fan displays as
yellow. A green box with a white check mark represents a healthy, fully functioning fan.