
Owner manual

56 HP VMA SAN Gateway User’s Guide AM456-9026A
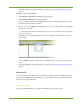
You can also choose to view the aggregate data (A+B) from both SAN Gateway nodes, or view data
for the nodes separately (A, B). If you select the A only or B only option, only the data for that
particular node is shown.
To customize the data output display, do the following:
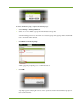
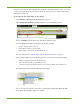
1. Select Monitor > Overview. The Monitoring page appears.
2. Click Settings & Download. The panel expands to show the following options.
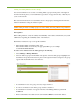
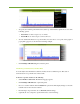
3. Select a Container name from the drop-down list to display its data.
4. Select the Type of information to display from the drop-down list.
•
General—Monitors data for all ports.
• LUN—Monitors data for a specific LUN.
• Fibre Channel—Monitors data for Fibre Channel ports.
For more information, see Monitoring Container, LUN, and Port Data on page 57.
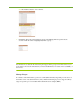
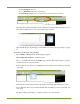
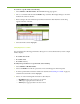
5. Select a Metric display type from the drop-down list, as shown in the following example.
•
A+B shows aggregated data for both Gateway nodes.
• A, B shows data separately for both Gateway nodes.
• A only shows data for the Gateway master node. B only shows data from the standby node.
The results appear in the Current Value panel on the right.
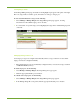
6. Choose an option from the drop-down list to customize the graph display. The Real-Time
Performance Trend display changes accordingly.