
Owner manual

AM456-9026A HP VMA SAN Gateway User’s Guide 57
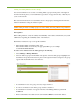
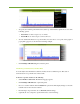
7. To specify the real-time performance trend, at the top of the left-most panel choose one of the
following options:
• Last 1 H:
Shows data averaged every one minute.
• Last 24 H: Shows data averaged over the last 24 hours.
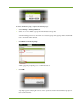
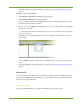
8. To view detailed information for a point in time, move the cursor over a point on the graph. A
pop-up dialog appears, as shown in the following example.
9. Click Settings & Download again to hide the panel.
Monitoring Container, LUN, and Port Data
You can analyze data in different containers, LUNs, and across different ports. This section
demonstrates how to perform each of these tasks.
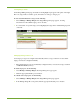
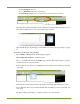
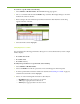
To monitor a specific container, do the following:
1. Select Monitor > Overview. The Monitoring page appears.
2. Click Settings & Download to expand the panel.
3. Choose a container name from the Container drop-down list. The display changes to show the
real-time data for the selected container.
4. From the Type drop-down list, choose General (default setting).
5. (Optional) To save a snapshot of performance data, do the following: