
Owner manual

AM456-9026A HP VMA SAN Gateway User’s Guide 61
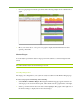
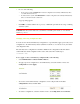
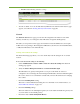
5. Choose a graph type from the drop-down list. The following example shows a Stacked Area
graph.
6. Move your mouse cursor over a point on a graph to display detailed information for that
specific point in time.
Monitor Targets
You can analyze performance data for target ports in time statistics, as well as using historical
trends.
Note: Fibre Channel data is shown in frames per second.
Selecting a Target Port
The target ports configured for your system are easily accessible from the Monitor Targets page.
To select a target port for monitoring, do the following:
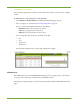
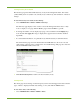
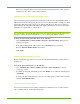
1. Select Monitor > Monitor Targets. The Target Port Monitoring page appears. Statistics for
each target port are shown in the left panel, with real time data in a graph format on the right.
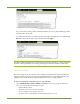
2. Select a port name from the list on the left so that it highlights. The graphs on the right side of
the window change to display data for the selected target.