
Use and Care Manual

79
Chart Options
A
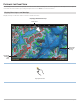
djust the Depth Range and Colors (Humminbird Chart Cards)
Humminbird Chart Card must be selected as the map source to enable the following features. See Map Source: Using Chart Cards.
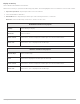
1. From the Humminbird Settings menu, select the settings shown in the table below.
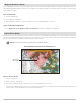
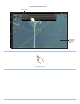
Show/Hide Spot Soundings (Humminbird Basemap)
Spot Soundings are depth measurements shown on the chart. The available settings are determined by the installed map card and
selected map source. Humminbird Basemap must be selected as the map source.
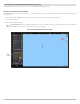
1. From the Humminbird Settings menu, select Spot Soundings.
2. Select On or Off.
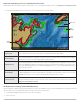
depth colors
contour
interval
depth
highlight
shallow
water
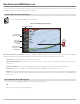
Depth Colors Turn on Depth Colors and adjust the range for depth shading in the Chart Views.
Depth Highlight
Turn on Depth Highlight to highlight a depth setting in the Chart Views. The depth you set will be
highlighted in green. Use Depth Highlight with Highlight Range.
Highlight Range
When a Depth Highlight is active in the Chart Views, use Highlight Range to highlight a range on each
side of the highlighted depth. For example, if you know a certain fish is holding at 18 to 20 feet, you
can set the Depth Highlight at 19 feet, and the Highlight Range a +/– 1 foot. The view will show a green
band from 18 to 20 feet.
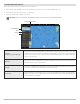
Shallow Water
Turn on Shallow Water and adjust the slider. When the depth is equal to or less than the amount set,
it will be highlighted in red in the Chart Views. For example, if your boat has a draft of 3 feet, set the
Shallow Water menu to 3 feet, and the unit will draw a red band from 0 to 3 feet.
Contour Interval
Turn on Contour Interval to display lines at set intervals on the Chart View. Adjust the slider to set the
distance between each line. Contour Interval is also affected by the Water Level Offset setting. See
Map Source: Using Built-in Charts.