
User Guide


of the water and back again. Experienced anglers use the appearance of the second return to determine bottom hardness.
Hard bottoms will show a strong second return, while soft bottoms will show a very weak one or none at all. The Matrix unit
is capable of revealing layers of water with different temperatures called thermoclines. Thermoclines appear at different
depths and different times of the year. A thermocline typically appears as a continuous band of many gray levels moving
across the display at the same depth.
Due to the transducer beam angle, the distance to a fish decreases as the fish moves into the beam, and then increases as it
moves out again, creating a Fish Arch when this distance change is graphed on the display. Boat speed, chart speed, and the
position of the fish within the sonar beam greatly affect the shape of the arch. For optimum fish arching, it is important to
mount the transducer so that it is pointing straight down. The Matrix unit has an advanced Selective Fish ID+
TM
option that
analyzes the sonar return to determine if the sonar return may contain a fish (see Sonar Settings - Main
Menu System). When a target is detected, a Fish ID+
TM
symbol appears on the display with the depth. The size of the symbol
indicates the intensity of the sonar return. Targets detected in the narrow beam directly under the boat appear as Solid Fish
Symbols. Targets detected in the wide beam around the boat appear as Hollow Fish Symbols. The Matrix unit will clearly show
schools of Bait Fish as "clouds" of different shapes and sizes, depending on the number of fish and boat speed.
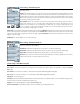
Sonar Zoom View increases the display resolution to separate sonar returns that are very close together,
such as those caused by fish suspended close to the bottom or within structure. In Zoom View, the
display is split to show a full range view on the right and the zoomed view on the left. As the depth
changes, the zoomed view updates automatically to display a magnified image of the bottom. The Zoom
Preview Box shows where the zoomed view is in relation to the full range view. The Zoom Level, or
magnification, is displayed in the lower left corner and can be changed to suit conditions (see Sonar
Settings - X-Press Menu). Upper and Lower Zoom Depth Range numbers indicate the depth of the water which is being viewed.
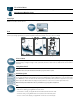
Big Digits View provides digital data in a large, easy-to-see format. Depth and battery voltage are always displayed. Readouts
for temperature, speed and Triplog information are displayed if the appropriate accessory is connected to the system. The
Triplog shows distance traveled, average speed, and time elapsed since the Triplog was last reset (see System Settings - Main
Menu Setup Tab).
Sonar Settings - X-Press
TM
Menu
The X-Press menu represents the settings most frequently-used to optimize the sonar performance of the Matrix unit.
Press the MENU key once while in a Sonar View to access the following X-Press menu settings quickly:
Sensitivity provides advanced control over the sonar receiver. The Matrix unit optimizes Sensitivity based on depth and
water conditions automatically; however, you also may change it manually to match your preferences or water
conditions. Increasing the sensitivity shows more sonar returns from small bait fish and suspended debris in the
water; however, the display may become too cluttered in some water conditions. When operating in very clear water
or greater depths, increased sensitivity shows smaller returns that may be of interest. Decreasing the sensitivity
eliminates the clutter from the display that is sometimes present in murky or muddy water. If Sensitivity is adjusted
too low, the display may not show many sonar returns that could be fish.
Upper Depth Range adjusts the Sonar View upper range to a specific depth. Zero (0) is the default setting.
Lower Depth Range adjusts the Sonar View lower range to a specific depth. Automatic is the default setting. Selecting a specific setting locks the
depth range into manual mode. Advanced anglers use both Upper and Lower Depth Range together to view a specific depth range manually when
looking for fish or bottom structure.
Chart Speed determines the speed at which the bottom information moves across the display, and consequently the amount of detail shown. A
faster speed shows more information in the Sonar View and is preferred by most anglers; however, the bottom moves across the display quickly.
The highest setting is an ultrafast mode that provides the highest chart speed possible by slowing down other system functions. A slower speed
keeps the information on the display longer, but the bottom and fish detail becomes compressed and may be difficult to interpret. Regardless of
the Chart Speed setting, the RTS® Window will update at the maximum rate possible for the depth conditions. Adjust Chart Speed to your personal
preference.
Zoom Level sets the magnification level on the Sonar Zoom View.
Temp/Speed Accessory
is optional.
Sonar Zoom View shown
with Structure ID® on
Big Digits View shown
with Bottom View
set to Bottom Black