
User's Manual


© IceRobotics Ltd 2012 Page 29 V0.15 EN(UK)Nov 2012
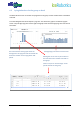
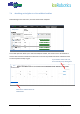
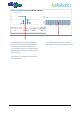
This display shows the lying distribution for
your herd. Each portion of the graph (each
bar) equals the number of cows that are
lying for XX hrs per day. For example on the
graph above, 83 cows in this herd lay for 10-
12hrs per day.
Click on the bar to display a list of the cows
within that group.
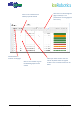
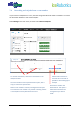
This graph
shows the total herd average
lying time for each day over a 60 day period.