
User's Manual


© IceRobotics Ltd 2012 Page 31 V0.15 EN(UK)Nov 2012
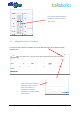
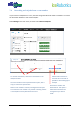
8.3 IceScore Mobility Historic Performance
IceScore Mobility Historic Performance shows the IceScores of the herd over time, allowing trends
to be identified. This can be viewed by selecting the historic performance link. A graph similar to the
one below will be shown.
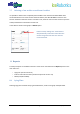
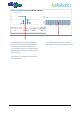
8.4 IceQube Population
The IceQube Population chart shows the entire population of the IceQubes registered to the farm.
Each segment of the pie chart shows the number of IceQubes seen over the indicated time period.