
User's Manual


© IceRobotics Ltd 2012 Page 12 V0.15 EN(UK)Nov 2012
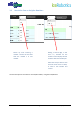
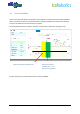
4.2 Behaviour Graph: Multi-day view
An example of a 30 day activity graph is shown below. The activity graphs include the following
information:
• MotionIndex – how active the animal has been (thick pink line)
• MotionIndex 7 day average (thin pink line)
• Lying/standing (thick grey line)
• Lying time 7 day average (thin grey line)
• Steps (thick blue line)
• Steps 7 day average (thin blue line)
• IceScore
Click on any of these headings to show or hide
that feature on the graph
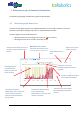
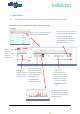
Lying time (highe
r
values indicate
that the cow is
lying for longer)
MotionIndex
IceScore: Numbers above 2
denote a potential health
problem
Lying time
average. Note
that this is very
consistent for this
cow.