© IceRobotics Ltd 2012 Page 19 V0.15 EN(UK)Nov 2012
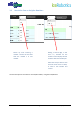
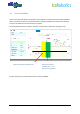
Below is an example of a 90 day graph showing only the lying time plus 7 day average lying time.
Hiding the Steps and MotionIndex from
view clearly shows the lying pattern and
lying time trend of this animal.