
User's Guide


Temperature data logger LT2
User Guide
CUG00028-EN-A01
IJINUS - 25 ZA de Kervidanou 3, 29300 MELLAC – France : +33 2 98 09 03 30 – Customer Service: +33 2 98 09 03 32 / sav@ijinus.com
8
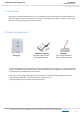
Choose the measuring period by setting the interval and click on the “Begin Measure” button:
A pop up will appear confirming the recording state
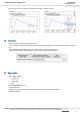
4.2 Displaying the measures
From the graph and/or list of data you find the tab “Export the measures” with the choice of different files
format and style.
You have 3 options to retrieve the data. Once retrieved, they are displayed on the graph
You can zoon into the graph with your cursor clicked. By passing your cursor along the curve you are able to
check the measures. To un-zoom the graph, right click and choose from the menu “Un-zoom”.