Digital Concrete Test Hammer CN652 Impact Test Equipment Ltd www.impact-test.co.uk & www.impact-test.
Impact Test Equipment Ltd. Building 21 Stevenston Ind. Est. Stevenston Ayrshire KA20 3LR T: 01294 602626 F: 01294 461168 E: sales@impact-test.co.uk Test Equipment Web Site www.impact-test.co.uk Test Sieves & Accessories Web Site www.impact-test.
Contents 1 Safety General Information Liability Safety Regulations Standards and Regulations Applied 2 Product Description 3 Startup Connecting the Components Putting the Display Unit into Operation 4 Settings Impact Direction Mean Value Measure Series Number Conversion Corrections Display Range Limit Values Language Date / Time Data Output 5 Measuring Process Measuring Procedure Data Output 6 Maintenance and Care Cleaning After Use Performance Check Storage Maintenance 7 Data Form of Delivery Accessories /
1 Safety 1.1 General Information 1.1.1 Basic Information The concrete test hammer is designed according to state-of-the-art technology and the recognized safety regulations. Please read through these operating instructions carefully before initial startup. They contain important information about safety, use and maintenance of the DIGISCHMIDT 2000 concrete test hammer. 1.1.
1.3.3 Safety Icons The following icons are used in conjunction with all important safety notes in these operating instructions. Danger! This note indicates a risk of serious or fatal injury in the event that certain rules of behavior are disregarded. Warning! This note warns you about the risk of material damage, financial loss and legal penalties (e.g. loss of warranty rights, liability cases, etc.) This denotes important information. 1.
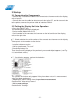
The DIGI-SCHMIDT 2000 concrete test hammer comprises the actual concrete test hammer and the display unit. Both components belong together and are calibrated as one unit. The impact bolt of the concrete test hammer strikes the surface of the concrete with a defined force. After the impact, a metal body, the so-called hammer (see pos. 14 in Fig. 6.2, page 16), rebounds. The rebound distance is measured by a sensor and passed on to the display unit as an electrical signal.
3 Startup 3.1 Connecting the Components • Connect the Test hammer cable to the concrete test hammer and to the display unit at input B. • Connect the transfer cable for data transmission to the PC, and for transmission to the printer, connect the printer cable to interface RS232. 3.2 Putting the Display Unit into Operation • Press the ON/OFF key.
4 Settings The display unit has a menu with user navigation. Please follow the instructions in the respective display fields. • Press the MENU key to display the main menu: Warning! Check the settings before performing a measurement! This applies in particular for the impact direction and for the shape and time coefficient. 4.1 Impact Direction • Select the symbol for the desired impact direction. The rebound value is automatically corrected according to the preselected impact direction. 4.
4.4.2 Select Curve The compressive strength of the concrete fck can be calculated from the rebound value R by means of conversion curves. There are 3 options available for calculating the compressive strength of the concrete: - No conversion - Select 5 internal conversion curves, or - Choose between 2 programmed PROCEQ standard curves (fck 7 days and fck 14 to 56 days). No Conversion Select ”No Conversion”.
Shape of the test specimen: Shape coefficient also applies for: 2nd Line: 200/200/200 Cylinder Ø 200 x 200 mm 3rd Line: 150/150/150 Cylinder Ø 150 x 150 mm 4th Line: Ø 150/300 mm Cylinder Ø 6” x 12” 4.5.2 Time Coefficient 〈t There are two options available: - Determining ones own time coefficient - Time coefficient as a function of the carbonate penetration depth Ones Own Time Coefficient • Select 〈t, and enter the time coefficient determined. See example under ”Determining Time Coefficient”.
Mx: Delete the Lowest and Highest Values Only possible from EPROM version 2.0. The amount ”m” of both the lowest and highest values are deleted. • Under ”m”, enter the number of measured values to be eliminated. See also the number of test impacts ”n” set, under ”Mean Value”. Example: If ”m” = 3, then at least 12 should be set for ”n”. 4.6 Display Range The display range for the rebound value R on the display can be adapted to the testing range. • Enter Rmin and Rmax. 4.
5 Measuring Process 5.1 Measuring Procedure Preferably perform measurements at temperatures between 10 °C and 50 °C only. The items in (brackets) are illustrated in Fig. 5.4. Perform test impacts with the concrete test hammer on a smooth, hard surface, without the cable connected to the display unit, before taking any measurements you are going to evaluate. • • Enter the basic settings as described under ”Settings”. Use a grindstone to smoothen the test surface. Fig. 5.
• Obvious outliers can only be eliminated directly after the particular test impact with the PRINT/STORE key. End Measurement Series: • After the last impact of a measurement series has been carried out, a low beep sounds. If n = 0 was set under ”Calculation of Mean Value”, you must end the measurement series with the END key. New Measurement Series: The measured values set remain unaltered: • Continue from Fig. 5.1 on page 10 with ”Preparing the test surface with a grindstone”.
5.2.2 Clear Memory Objects cannot be deleted individually. You can only delete the entire memory contents. This action cannot be undone after it has been confirmed. 5.2.3 Display Memory The measurement series number, the impact direction of the concrete test hammer and the measured rebound values R after deletion of the outliers, as well as the average of the rebound values or of the compressive strength of the concrete are displayed. 5.2.
6 Maintenance and Care 6.1 Cleaning After Use Warning! Never immerse the concrete test hammer in water or clean it under a running tap! Use neither abrasives nor solvents for cleaning! 6.1.1 Concrete Test Hammer • Deploy the impact plunger (1) as described in Fig. 5.2. • Wipe the impact plunger (1) and housing (3) using a clean, dry cloth. 6.1.2 Display Unit • Clean the display unit and measuring equipment with a clean, dry cloth after use. • Clean the input sockets and connectors with a clean, dry brush.
6.2.2 Display Unit • Check the surface of the outer sheath of the cable and the connector for damage. • Check the life of the batteries. • If a battery life of 4 to 6 hours is indicated on the display unit, you should take a new set of batteries to the measuring site. 6.3 Storage • Store the concrete tester and accessories in the original case in a clean, dustfree room. • If the unit is not used for a long period of time, remove the batteries. 6.
• Pull the hammer mass (14) off the hammer guide bar together with the impact spring (16) and sleeve (17). • Remove the felt ring (18) from the cap (9). 6.4.2 Cleaning • Lay all parts except for the housing (3) in kerosene and clean them using a brush. • Use a round brush (copper bristles) to clean the hole in the impact plunger (1) and the hammer mass (14) thoroughly. • Let the fluid drip off the parts and then rub them dry with a clean, dry cloth.
6.4.4 Concrete Test Hammer Model ND/LD Fig. 6.2 Lengthways section through the concrete test hammer 13 Pawl 14 Hammer mass: 14.1 model ND, 14.
7 Data 7.
7.2 Accessories / Spare Parts Designation Article no. Protection sleeve for display unit Transfer cable 9/9-position Printer cable 9/9+25-position for printer with serial port Test hammer cable Grindstone Carrying case 330 00 470 330 00 456 330 00 460 380 02 510 310 99 037 340 00 281 7.3 Technical Data 7.3.1 Display Unit - Measuring range from 10 to 70 N/mm2 compressive strength of the concrete - Non-volatile memory for max.
8 Appendix 8.1 Derivation of the PROCEQ Standard Conversion Curves The conversion curves Fig. 8.1 and Fig. 8.2 for the concrete test hammer are based on measurements taken on very many sample cubes. The rebound values R of the sample cubes were measured using the concrete test hammer. The compressive strength was then determined with the pressure testing machine. In each test, at least 10 test hammer impacts were performed on one side of the sample cube which was lightly clamped in the press.
Standard Conversion Curve for Concrete Test Hammer Model LD Mean value has already been corrected in relation to the impact direction Fig. 8.2 Model LD: Conversion curve based on the average compressive strength of a cylinder and the rebound value R Limits of Distribution : The max. and min. values are set so that 80 % of all test results are included. 8.
The relationship between the rebound value R and the compressive strength of the concrete fck is determined using test specimens of a certain type of concrete. Proceed as follows: • Take test specimens following the regulations applying in the particular country. • In a pressure testing machine, apply force on the test specimens with a force of 40 kN, vertical to the direction in which the concrete was poured.
8.4 Determining Time Coefficient The age of the concrete and its carbonate penetration depth can significantly increase the measured rebound values R. It is possible to obtain accurate values for the effective strength by removing the hard, carbonate-impregnated surface layer using a manual grinding machine over a surface area of about Ø 120 mm and performing the measurement on the non-carbonate-impregnated concrete. The time coefficient, i.e.