
User guide


6 - 13
PN 074-566-P1B
Composer Elite Operating Manual
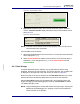
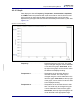
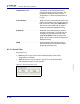
6.3.10 Graph
Tabs display the data of Frequency, Temperature, Concentration, Amplitude,
and PWM. Charts are presented with most recent data on the left, which moves
right over time as newer data is added. Presented ranges can be manually
adjusted using the upper and lower bounds immediately to the left of the y axis. See
Figure 6-12.
Figure 6-12 Graph display
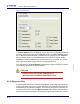
Frequency . . . . . . . . . . . . . . . . . . . . Resonant frequency of the cell. The scale
may be changed using the numeric data lists
on the left of the graph. Auto Scale, at the
top right of the graph, can be used to center
the data to the displayed scaling.
Temperature 1 . . . . . . . . . . . . . . . . . Temperature of the Acoustic Sensor’s
resonant chamber. The scale may be
changed using the numeric data lists on the
left of the graph. Auto Scale, at the top right
of the graph, can be used to center the data
to the displayed scaling.
Temperature 2 . . . . . . . . . . . . . . . . . Temperature of the Acoustic Sensor’s inlet
tube. The scale may be changed using the
numeric data lists on the left of the graph.
Auto Scale, at the top right of the graph, will
center the data to the appropriate range.