
User guide


6 - 14
PN 074-566-P1B
Composer Elite Operating Manual
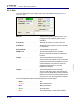
Temperature 1 & 2 . . . . . . . . . . . . . Comparison of the temperatures of the
resonant chamber and the inlet tube. The
temperature and trend graph will show
Temperature 1 in black and Temperature 2
in grey.
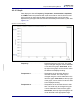
Concentration. . . . . . . . . . . . . . . . . Mole % as seen in the upper left corner of the
display. The scale may be changed using the
lists on the left of the graph. Auto Scale, at
the top right of the graph, can be used to
center the data to the displayed scaling.
Amplitude . . . . . . . . . . . . . . . . . . . . Amplitude of the peak frequency used to
calculate concentration. The scale may be
changed using the lists on the left of the
graph. Auto Scale, at the top right of the
graph, can be used to center the data to the
displayed scaling.
PWM . . . . . . . . . . . . . . . . . . . . . . . . Power applied to the Acoustic Sensor’s
resonant chamber and inlet tube heaters
(diagnostic purposes only).
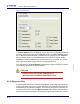
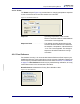
6.3.11 Screen Shot
See Figure 6-13.
Print will print a copy of the current software display on the printer
assigned to the computer.
Save will save the screen shot as a .png file to a user-defined name
and selectable location on the computer.
Figure 6-13 Screen shot print and save