
Install Instructions
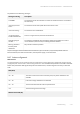
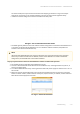
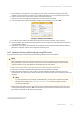
Table Of Contents
- About This Manual
- Important Notice
- Introduction
- Document structure
- Document marks
- Key Features
- Hardware Platform
- Power supply
- Lightning protection unit
- Synchronization unit
- // 0) { /* For each inline-commented element clear data-ref and class */ for (var i=0; i < commentedElements.length; i++) { commentedElements[i].dataset.ref= ""; commentedElements[i].className = ""; } } /* Else do nothing */ } }); //]> AUX-ODU-SYNC Mounting
- AUX-ODU-SYNC Cable gland Assembling
- AUX-ODU-SYNC Connection to ODU
- Packing List
- Planning considerations
- Link Pre-configuration in the lab
- Installation
- Operation & Administration
- Troubleshooting
- Glossary

Infinet Wireless: Technical Documentation – InfiMAN Evolution
51 https://wiki.infinetwireless.com/pages/viewpage.action?pageId=43827064
52 https://wiki.infinetwireless.com/pages/viewpage.action?pageId=10781010
Troubleshooting – 152
•
•
•
103 Figure - General statistics
Pay attention to the following indicators:
"Lost Frames" - the number of frames that were not received by the device, even after retrying.
"Aggr Subframe Retries" and "Aggr Full Retries"- the number of framesthat the device has sent several
times because the other side did not acknowledge the receipt.
"Excessive Retries"- the number of frames thatfailed to to be sent after all the retry attempts.
QoS statistics
Web interface
The "QoS statistics" section provides information about the transmitted and dropped packets in each priority
queue configured on the device. Drops present in the traffic processing queues indicate that the throughput
threshold has been exceeded. Losses in queue q00 (P16) are acceptable because this queue contains performance
test data.
104 Figure - QoS statistics
Command line interface
To display statistic via the command line interface, use the"rfconfig rf6.0 stat qos
51
"command.The number of
dropped packets for each configured queue can be displayed by the "qm stat
52
" command.
8.4.3 Statistics graphs
If the link has deteriorated during its operation, having the initial parameters corresponding to the calculated ones,
it is necessary to find out when the problem has occured.Use the "Statistics graphs" tool to determine when or how
often the problem occurs by changing the display options.