
Users Manual


171
Understanding PDM and Pod Function 1212 Understanding PDM and Pod Function
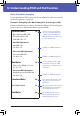
Calculations for History Summaries
is section lists the calculations for the summary data shown on the one day and
multiple day history screens.
Blood glucose summaries
e calculations used for the blood glucose summaries include readings from a
paired BG meter and manually-entered readings, with the exception that they do
not include control solution records. e calculations do include any HI and LO
readings unless otherwise noted. e multi-day calculations include all days in the
time period.
Summary
item
Calculation
Row 1 (see page 90)
Average BG
=
Sum of all BG readings
Total number of BG readings
Note: e sum and the total do not include HI or LO blood
glucose readings.
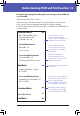
BG in
Range
=
Number of BG readings within BG Goal Range
x 100
Total number of BG readings
BGs Above
=
Number of BG readings above BG Goal Range upper limit
x 100
Total number of BG readings
BGs
Below
=
Number of BG readings below BG Goal Range lower limit
x 100
Total number of BG readings
Row 2 (see page 90)
Avg
Readings
per Day
= Number of BG readings
Number of days
Note: is appears in the multiple day view only.
Number
of BG
Readings
= Total number of BG readings in the day (or date range)
Highest BG = Highest BG reading in the day (or date range)
Lowest BG = Lowest BG reading in the day (or date range)