
64-bit Intel Xeon Processor with 2MB L2 Cache Thermal/Mechanical Design Guidelines

64-bit Intel® Xeon™ Processor with 2MB L2 Cache Thermal/Mechanical Design Guidelines 15
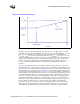
Thermal/Mechanical Reference Design
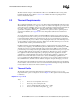
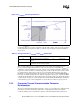
The higher end point of the Thermal Profile represents the processor’s TDP and the associated
maximum case temperature (T
CASE
MAX). The lower end point of the Thermal Profile represents
the power value (P
CONTROL_BASE
) and the associated case temperature (T
CASE
MAX@
P
CONTROL_BASE
) for the lowest possible theoretical value of T
CONTROL
(see Section 2.2.2). The
slope of the Thermal Profile line represents the case-to-ambient resistance of the thermal solution
with the y-intercept being the local processor ambient temperature. The slope of the Thermal
Profile is constant between P
CONTROL_BASE
and TDP, which indicate that all frequencies of a
processor defined by the Thermal Profile, will require the same heatsink case-to-ambient
resistance.
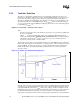
In order to satisfy the Thermal Profile specification, a thermal solution must be at or below the
Thermal Profile line for the given processor when its diode temperature is greater than T
CONTROL
(refer to Section 2.2.2). The Thermal Profile allows the customers to make a trade-off between the
thermal solution case-to-ambient resistance and the processor local ambient temperature that best
suits their platform implementation (refer to Section 2.2.3). There can be multiple combinations of
thermal solution case-to-ambient resistance and processor local ambient temperature that can meet
a given Thermal Profile. If the case-to-ambient resistance and the local ambient temperature are
known for a specific thermal solution, the Thermal Profile of that solution can easily be plotted
against the Thermal Profile specification. As explained above, the case-to-ambient resistance
represents the slope of the line and the processor local ambient temperature represents the y-axis
intercept. Hence the T
CASE
values of a specific solution can be calculated at the TDP and
P
CONTROL_BASE
power levels. Once these points are determined, they can be joined by a line,
which represents the Thermal Profile of the specific solution. If that line stays at or below the
Thermal Profile specification, then that particular solution is deemed as a compliant solution.
Figure 2-2. Thermal Profile Diagram