
Datasheet


INTEGRATION TOOLS
76
8. INTEGRATION TOOLS
The integration tool set for system designs will include an In-Target Probe (ITP) for program execution control,
register/memory/IO access, and breakpoint control. This tool provides functionality commonly associated with
debuggers and emulators. The ITP uses the on-chip debug features of the processor to provide program
execution control. Use of the ITP will not affect the high-speed operations of the processor signals, ensuring
the system can operate at full speed with the ITP attached.
This document describes the ITP as well as a number of technical issues that must be taken into account
when including the ITP and logic analyzer interconnect tools in a debug strategy. Although the tool description
that follows is specific to early tools available from Intel, similar tools may also be provided in the future by
third-party vendors. Thus, the tools mentioned should not be considered as Intel's tools, but as debug tools in
the generic sense.
In general, the information in this chapter may be used as a basis for including integration tools in any
Pentium® III Xeon™ processor at 700 MHz and 900 MHz-based system design. The logic analyzer
interconnect tool keep-out zones described in this chapter should be used as general guidelines for Pentium®
III Xeon™ processor at 700 MHz and 900 MHz system design.
8.1 In-Target Probe (ITP)
An In-Target Probe (ITP) for the processor is a debug tool that allows access to on-chip debug features via a
small port on the system board called the debug port. The ITP communicates to the processor through the
debug port using a combination of hardware and software. The software is a Microsoft* Windows* NT* 4.0-
based application running on a host PC. The hardware consists of a PCI board in the host PC connected to
the signals that make up the processor debug interface. Due to the nature of the ITP, the processor may be
controlled without affecting any high-speed signals. This ensures that the system can operate at full speed
with the ITP attached. Intel will use an ITP for internal debug and system validation and recommends
that all Pentium® III Xeon™ processor at 700 MHz and 900 MHz-based system designs include a
debug port. This is especially important if Intel assistance is required in debugging a system-processor
interrelationship issue.
8.1.1 PRIMARY FUNCTION
The primary function of an ITP is to provide a control and query interface for one or more processors. With an
ITP, one can control program execution and have the ability to access processor registers, system memory
and I/O. Thus, one can start and stop program execution using a variety of breakpoints, single-step the
program at the assembly code level, as well as read and write registers, memory and I/O. The on-chip debug
features will be controlled from a Microsoft* Windows* NT* 4.0 software application running on a Pentium® or
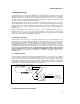
Pentium® Pro processor-based PC with a PCI card slot (See Figure 29).
PCI Add-In Card
Plugs in to your host PC (12.5 in.)
Debug Port
Connector
Connects to Debug
Port on target board
2m Cable
2 in. Cable
Buffer Board
000816a
Figure 29. Hardware Components of the ITP
8.1.2 DEBUG PORT CONNECTOR DESCRIPTION