
Uncore Manual

Uncore Performance Monitoring
Home Agent (HA) Performance Monitoring
60 Reference Number: 329468-002
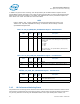
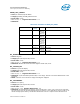
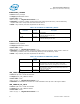
2.4.5 HA Box Common Metrics (Derived Events)
The following table summarizes metrics commonly calculated from HA Box events.
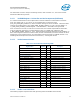
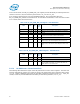
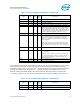
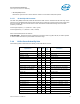
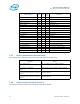
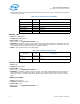
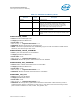
2.4.6 HA Box Performance Monitor Event List
The section enumerates performance monitoring events for the HA Box.
TxR_AD_CYCLES_FULL 0x2a 0-3 1 AD Egress Full
TxR_AK_CYCLES_FULL 0x32 0-3 1 AK Egress Full
TxR_BL_OCCUPANCY 0x34 0-3 20 BL Egress Occupancy
TxR_BL_CYCLES_FULL 0x36 0-3 1 BL Egress Full
RING_AD_USED 0x3e 0-3 1 HA AD Ring in Use
RING_AK_USED 0x3f 0-3 1 HA AK Ring in Use
RING_BL_USED 0x40 0-3 1 HA BL Ring in Use
DIRECTORY_LAT_OPT 0x41 0-3 1 Directory Lat Opt Return
BT_CYCLES_NE 0x42 0-3 1 BT Cycles Not Empty
BT_OCCUPANCY 0x43 0-3 512 BT Occupancy
BT_BYPASS 0x52 0-3 1 BT Bypass
OSB 0x53 0-3 1 OSB Snoop Broadcast
OSB_EDR 0x54 0-3 1 OSB Early Data Return
IODC_INSERTS 0x56 0-3 1 IODC Inserts
IODC_CONFLICTS 0x57 0-3 1 IODC Conflicts
IODC_OLEN_WBMTOI 0x58 0-3 1 Num IODC 0 Length Writes
IGR_CREDITS_AD_QPI2 0x59 0-3 1 AD QPI Link 2 Credit Accumulator
IGR_CREDITS_BL_QPI2 0x5a 0-3 1 BL QPI Link 2 Credit Accumulator
SNP_RESP_RECV_LOCAL 0x60 0-3 1 Snoop Responses Received Local
Symbol Name:
Definition
Equation
PCT_CYCLES_BL_FULL:
Percentage of time the BL Egress Queue is
full
TxR_BL_CYCLES_FULL.ALL / SAMPLE_INTERVAL
PCT_CYCLES_D2C_DISABLED:
Percentage of time that Direct2Core was
disabled.
DIRECT2CORE_CYCLES_DISABLED / SAMPLE_INTERVAL
PCT_RD_REQUESTS:
Percentage of HA traffic that is from Read
Requests
REQUESTS.READS / (REQUESTS.READS +
REQUESTS.WRITES)
PCT_WR_REQUESTS:
Percentage of HA traffic that is from Write
Requests
REQUESTS.WRITES / (REQUESTS.READS +
REQUESTS.WRITES)
Symbol Name
Event
Code
Ctrs
Max
Inc/
Cyc
Description