Intel® Inspector Get Started Guide
Intel® Inspector Get Started Guide Contents Get Started with Intel® Inspector.. 3 Get Started with Intel® Inspector-Windows* OS............................................. 4 Get Started with Intel® Inspector-Linux* OS .................................................
Get Started with Intel® Inspector Get Started with Intel® Inspector Intel® Inspector is a dynamic memory and threading error checking tool for users developing serial and multithreaded applications on Windows* and Linux* operating systems. This document summarizes the typical workflow to get started using the Intel Inspector GUI. Key Features Intel Inspector offers: • • • • • • • • • • Standalone GUI, Microsoft Visual Studio* plug-in, and command line operational environments.
Intel® Inspector Get Started Guide Intel disclaims all express and implied warranties, including without limitation, the implied warranties of merchantability, fitness for a particular purpose, and non-infringement, as well as any warranty arising from course of performance, course of dealing, or usage in trade.
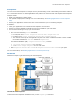
Get Started with Intel® Inspector Launch the Intel Inspector To launch the: • • Intel Inspector standalone GUI: Run the inspxe-gui command or from the Microsoft Windows* All Apps screen, select Intel Inspector [version]. Intel Inspector plug-in to the Visual Studio* IDE: Open your solution in the Visual Studio* IDE and click the icon. To launch the command line interface: Run the inspxe-cl command. (To get help, append -help to the command line.
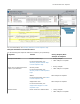
Intel® Inspector Get Started Guide Configure Analysis Intel Inspector offers a range of preset memory and threading analysis types (as well as custom analysis types) to help you control analysis scope and cost. The narrower the scope, the lighter the load on the system. The wider the scope, the larger the load on the system. Tip Use analysis types iteratively. Start with a narrow scope to verify your application is set up correctly and set expectations for analysis duration.
Get Started with Intel® Inspector For more information, see Choosing Problems in Intel Inspector Help. Interpret Result Data and Resolve Issues Use the following Intel Inspector features to enhance your productivity: Objective Feature Interpret result data. Explain Problem Help For more information, see Accessing Explain Problem Help in Intel Inspector Help. Focus only on those issues that require your attention. Severity Levels For more information, see Severity Levels in Intel Inspector Help.
Intel® Inspector Get Started Guide Objective Feature During Analysis/After Analysis Is Complete For more information, see Editing Source Code in Intel Inspector Help. Learn More Document/Resource Description Intel Inspector: Featured Documentation An excellent overall resource for novice, intermediate, and advanced users, this page includes links to guides, release notes, videos, featured topics, training samples, and more.
Get Started with Intel® Inspector Prerequisites You can use the Intel Inspector to analyze memory and threading errors in both debug and release modes of C++ and Fortran binaries. To build applications that produce the most accurate and complete Intel Inspector analysis results: • • • Build your application in debug mode. Use optimal compiler/linker settings. For more information, see Building Applications in Intel Inspector Help.
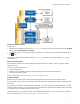
Intel® Inspector Get Started Guide To launch the command line interface: Run the inspxe-cl command. (To get help, append -help to the command line.) Choose/Create Project Intel Inspector is based on a project paradigm and requires that you create or open a project to enable analysis features.
Get Started with Intel® Inspector • • • Groups detected problems into problem sets (but still provides visibility into individual problems and problem occurrences). Prioritizes the problem sets. Offers filtering to help you focus on those problem sets that require your attention. For more information, see Choosing Problems in Intel Inspector Help. Interpret Result Data and Resolve Issues Use the following Intel Inspector features to enhance your productivity: Objective Feature Interpret result data.
Intel® Inspector Get Started Guide Objective Feature Resolve issues. Direct access to a default editor For more information, see Editing Source Code in Intel Inspector Help.