
User Guide


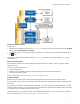
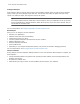
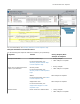
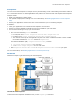
Table Of Contents

Intel disclaims all express and implied warranties, including without limitation, the implied warranties of
merchantability, fitness for a particular purpose, and non-infringement, as well as any warranty arising from
course of performance, course of dealing, or usage in trade.
Get Started with Intel® Inspector-Windows* OS
Intel
®
Inspector is a dynamic memory and threading
error checking tool for users developing serial and
multithreaded applications on Windows* and Linux*
operating systems. This topic is part of a Getting
Started document that summarizes an end-to-end
workflow you can apply to your applications.
Prerequisites
You can use the Intel Inspector to analyze memory and threading errors in both debug and release modes of
C++ and Fortran binaries. To build applications that produce the most accurate and complete Intel Inspector
analysis results:
• Build your application in debug mode.
• Use optimal compiler/linker settings. For more information, see Building Applications in Intel Inspector
Help.
• Ensure your application creates more than one thread before you run threading analyses.
In addition:
• Verify your application runs outside the Intel Inspector environment.
• Run the <inspector-install-dir>\inspxe-vars.bat command. .
The default installation path, <inspector-install-dir>, is below C:\Program Files (x86)\Intel
\oneAPI\inspector (on certain systems, instead of Program Files (x86), the directory name is
Program Files ).
NOTE Setting up your environment is necessary only if you plan to use the inspxe-gui command to
launch the Intel Inspector standalone GUI interface or the inspxe-cl command to run the command
line interface.
For more information, see Building Applications in Intel Inspector Help.
Get Started
Follow these steps to get started using the Intel Inspector.
Intel
®
Inspector Get Started Guide
4