
User Guide


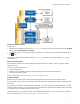
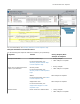
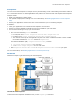
Table Of Contents

Launch the Intel Inspector
To launch the:
• Intel Inspector standalone GUI: Run the inspxe-gui command or from the Microsoft Windows* All Apps
screen, select Intel Inspector [version].
• Intel Inspector plug-in to the Visual Studio* IDE: Open your solution in the Visual Studio* IDE and click
the
icon.
To launch the command line interface: Run the inspxe-cl command. (To get help, append -help to the
command line.)
Choose/Create Project
Intel Inspector is based on a project paradigm and requires that you create or open a project to enable
analysis features.
Think of an analysis project as a:
• Compiled application
• Collection of configurable attributes, including suppression rules and search directories
• Container for analysis results
For more information, see
Choosing Projects in Intel Inspector Help.
Configure Project
Data set size and workload have a direct impact on application execution time and analysis speed.
For best results, choose small, representative data sets that create threads with minimal to moderate work
per thread.
Your objective: In as short a runtime period as possible, execute as many paths and the maximum number
of tasks (parallel activities) as you can afford, while minimizing the redundant computation within each task
to the bare minimum needed for good code coverage.
Data sets that run a few seconds are ideal. Create additional data sets to ensure all your code is inspected.
For more information, see
Configuring Projects in Intel Inspector Help.
Get Started with Intel
®
Inspector
5