
User Guide


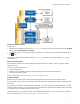
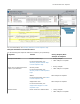
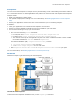
Table Of Contents

Configure Analysis
Intel Inspector offers a range of preset memory and threading analysis types (as well as custom analysis
types) to help you control analysis scope and cost. The narrower the scope, the lighter the load on the
system. The wider the scope, the larger the load on the system.
Tip
Use analysis types iteratively. Start with a narrow scope to verify your application is set up correctly
and set expectations for analysis duration. Widen the scope only if you need more answers and you
can tolerate the increased cost.
For more information, see Configuring Analyses in Intel Inspector Help.
Run Analysis
When you run an analysis, the Intel Inspector:
• Executes your application.
• Identifies issues that may need handling.
• Collects those issues in a result.
• Converts symbol information into filenames and line numbers.
• Applies suppression rules.
• Performs duplicate elimination.
• Forms problem sets.
• Depending on your analysis configuration options, may launch an interactive debugging session.
For more information, see Running Analyses in Intel Inspector Help.
Choose Problems
During analysis, the Intel Inspector displays problems in the order detected. After analysis is complete, the
Intel Inspector:
• Groups detected problems into problem sets (but still provides visibility into individual problems and
problem occurrences).
• Prioritizes the problem sets.
• Offers filtering to help you focus on those problem sets that require your attention.
Intel
®
Inspector Get Started Guide
6